


Western Union Stock, Invest in the Global Money Transfer Revolution
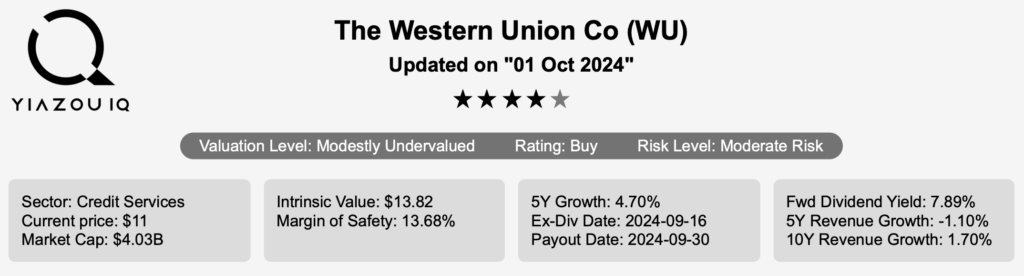
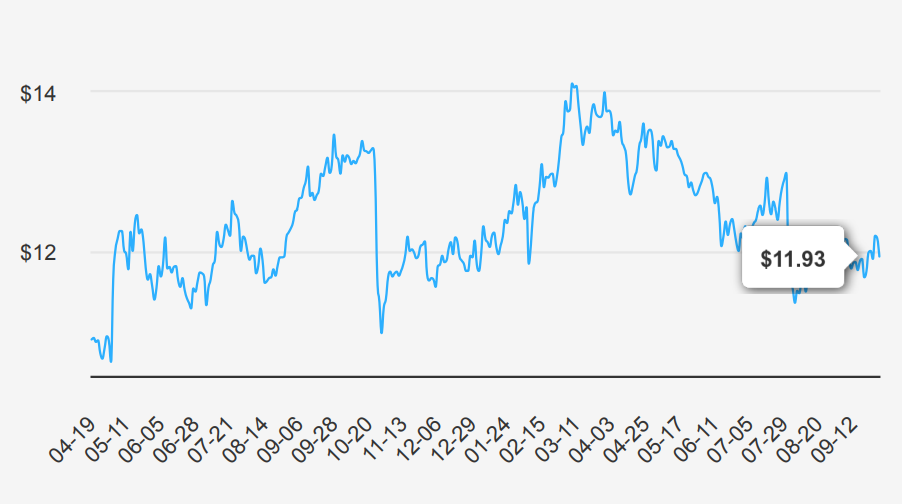
Western Union (WU) provides domestic and international money transfers through its global network of about 600,000 outside agents. The company handled over 270 million transactions in 2023 and is the largest money transfer company in the world. WU stock is currently trading at nearly $12.
Western Union’s Earnings: Trends and Future Prospects
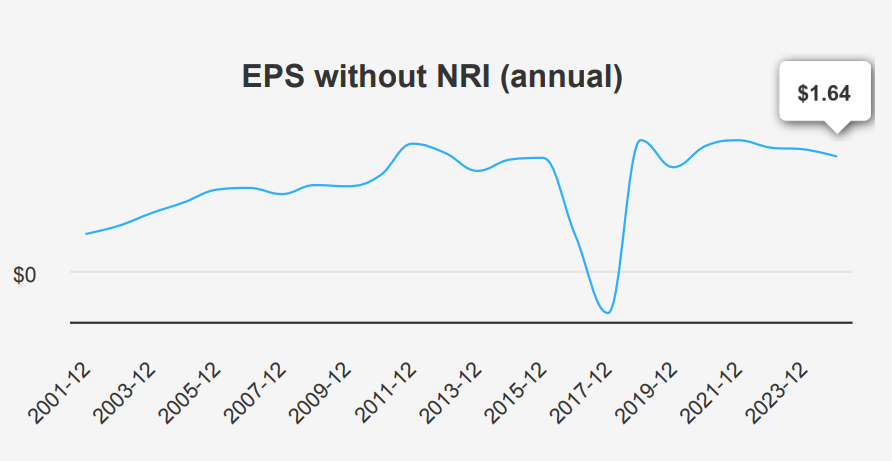
In the second quarter ending June 30, 2024, Western Union reported an EPS without non-recurring items (NRI) of $0.44, reflecting a modest quarter-over-quarter (QoQ) increase from $0.41 in Q1 2024 but showing a decline from $0.51 year-over-year (YoY) from Q2 2023. The diluted EPS remained steady at $0.41 QoQ but decreased from $0.47 YoY. Revenue per share increased to $3.14 from $3.035 in Q1 2024, indicating a recovery in sales momentum. The company’s 5-year CAGR for Annual EPS without NRI stands at 0.60%, while the 10-year CAGR remains flat, suggesting stable but slow growth over the past decade. Industry forecasts suggest a growth rate of approximately 4% annually over the next ten years, which could potentially drive future performance.
Western Union’s gross margin for the quarter was 37.91%, the lowest in the past decade, indicating pressure on profitability. This margin is below the 5-year median of 41.54%, highlighting a trend of declining profitability. The company has aggressively repurchased shares, with a 1-year buyback ratio of 9.80%, meaning 9.8% of shares were repurchased, which has helped support the EPS despite declining profits. Over the past three years, the buyback ratio averaged 5.20%, showing a consistent strategy to return value to shareholders.
Looking ahead, analysts estimate EPS to reach $1.689 for the next fiscal year and $1.807 the year after, suggesting earnings growth expectations. Revenue estimates project incremental growth, reaching $4,279.11 million by 2026. The next earnings release is expected on October 25, 2024, providing further insights into whether Western Union can meet or exceed these growth expectations amid ongoing industry changes.
Unlocking Value: Western Union’s Financial Efficiency Insights
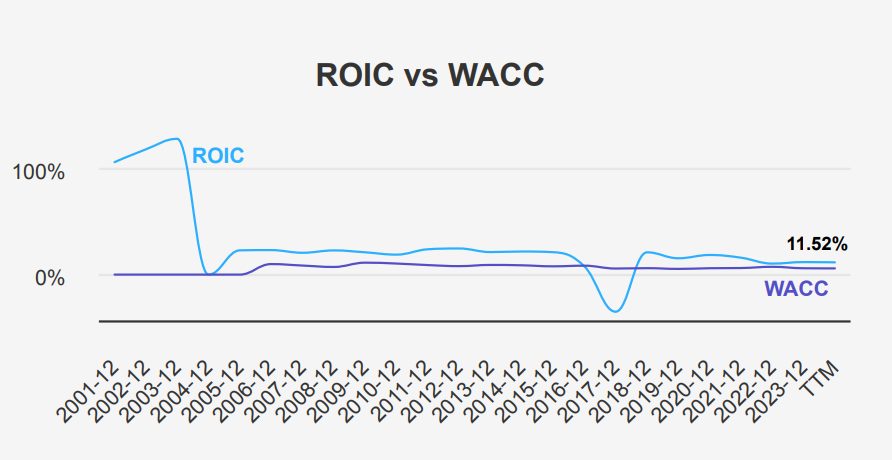
Western Union demonstrates strong performance in terms of economic value creation, as evidenced by its Return on Invested Capital (ROIC) consistently exceeding its Weighted Average Cost of Capital (WACC). Over a five-year median period, WU’s ROIC stands at 15.37%, significantly higher than the corresponding WACC of 6.01%. This indicates that WU effectively utilizes its invested capital to generate returns surpassing its cost of capital, thereby creating shareholder value.
The comparison of the current ROIC at 11.52% against the WACC of 5.91% further supports this positive value generation. The substantial gap between these figures shows that WU continues to allocate capital efficiently and earn returns above its cost of capital, suggesting a robust financial strategy.
Moreover, despite historical fluctuations, with the 10-year ROIC high at 21.71% and a low of -34.88%, the company’s ability to maintain an ROIC above WACC in recent periods highlights its resilience and effective capital management. This consistent value creation is a positive indicator for the WU stock forecast.
Western Union’s Dividend Yield, Growth, and Stability
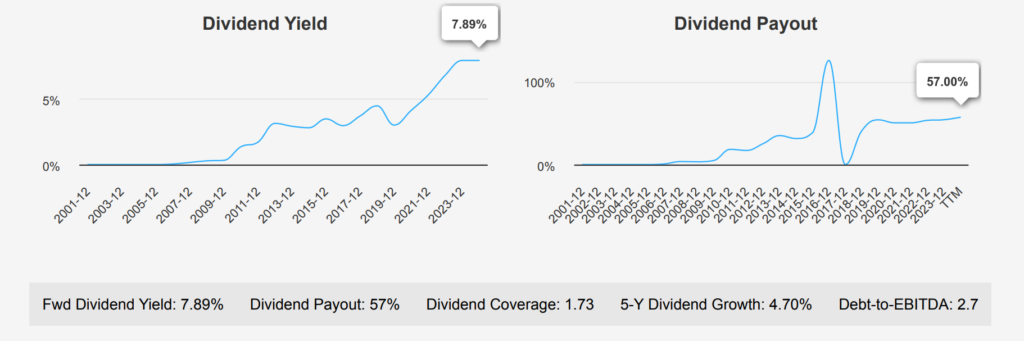
Western Union has shown steady dividend performance with a 5-year growth rate of 4.70% and a more recent 3-year growth rate of 1.50%. The company’s forward dividend yield stands at a robust 7.89%. This is attractive against the sector, though the growth projection is flat.
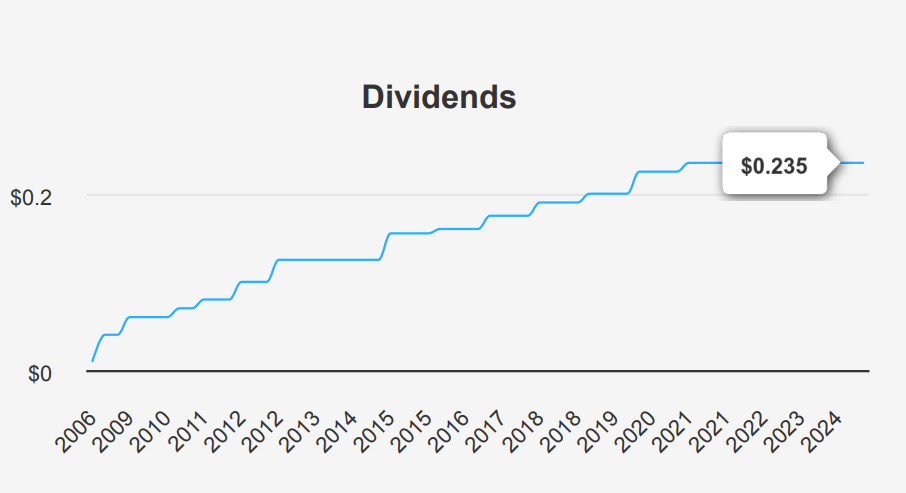
The dividend payout ratio is currently 57.0%, which is sustainable and lower than its historical highs. In the past ten years, payout ratios ranged significantly, with a high of 101.26%. This suggests improvements in earnings or a more conservative payout strategy.
WU’s debt-to-EBITDA ratio is 2.70, indicating moderate financial leverage. While this is within acceptable industry limits, continuous monitoring should be there due to its potential impact on financial flexibility and dividend sustainability.
The next ex-dividend date is ~December 19, 2024, following a quarterly distribution pattern. Overall, the WU stock forecast indicates a high yield, but the expected flat growth and moderate debt levels warrant investor caution.
Unlocking Value: The Western Union Stock Opportunity
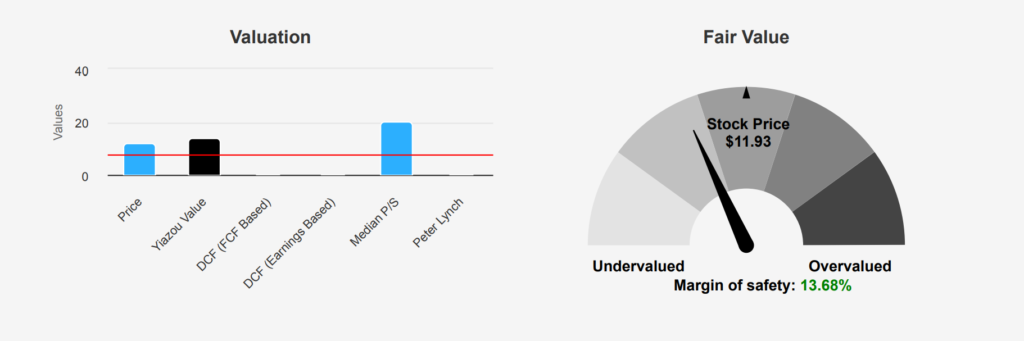
WU’s current market price stands at $11.93, below its intrinsic value of $13.82, suggesting a margin of safety of approximately 13.68%. This indicates that the stock might be undervalued, offering a potential buffer for investors. The Forward P/E ratio is 6.55, and the TTM P/E ratio is 7.32, both below the 10-year median of 10.81. This suggests that WU is trading at a relatively low valuation compared to its historical performance. Additionally, the TTM EV/EBITDA ratio is 3.93, close to its 10-year low of 3.64 and significantly lower than the 10-year median of 6.90, reinforcing the view of a potentially undervalued position.
Despite a TTM Price-to-Book (P/B) ratio of 9.11, higher than the 10-year median of 10.19, it remains below extreme historical peaks, indicating room for revaluation. The TTM Price-to-Sales (P/S) ratio is 0.99, slightly above its 10-year low of 0.93 but well below the median of 1.69, suggesting the stock is relatively cheap based on sales. The TTM Price-to-Free-Cash-Flow (P/FCF) stands at 9.64, beneath the 10-year median, indicating a reasonable valuation based on cash flow generation. These metrics collectively suggest potential undervaluation, especially when considering revenue and cash flow.
Analysts have set a price target of $12.96 under the WU stock forecast, slightly above the current price but below the intrinsic value, indicating moderate upside potential. Given its historical context and current metrics, the stock’s valuation appears attractive, possibly offering a buying opportunity. With 19 ratings and consistent price targets over recent months, analyst sentiment reflects cautious optimism, supporting the view that WU’s undervaluation is relative to historical and sector norms. The potential margin of safety, combined with favorable valuation multiples, positions WU stock worth considering for value-oriented investors.
Navigating Financial Waters: Risks and Opportunities Ahead
Western Union presents a complex risk profile. The concerning increase in Days Sales Outstanding suggests potential issues with cash flow management and customer payment collections. This, combined with declining revenue per share over the last five years, indicates potential challenges in maintaining or growing revenue streams. Perhaps most alarming is the company’s Altman Z-score of 0.99, which places it in the distress zone, signaling a heightened risk of bankruptcy within the next two years.
However, there are some positive indicators to consider. The Beneish M-Score of -2.98 suggests that Western Union is unlikely to manipulate its financial statements, providing transparency and reliability in its reported performance. Additionally, the company’s expanding operating margin is a positive sign, suggesting improved efficiency and cost management. The price-to-sales (PS) ratio at 1.01, close to its 10-year low, indicates that the stock holds undervaluation, presenting a potential opportunity for investors if the company can overcome its current challenges.
Overall, while significant risks are observable under the WU stock forecast, particularly regarding financial stability and revenue trends, improving operational efficiency and low valuation metrics could offer some upside if management can effectively address underlying issues.
Insider Trading Trends: Stability or Uncertainty for WU
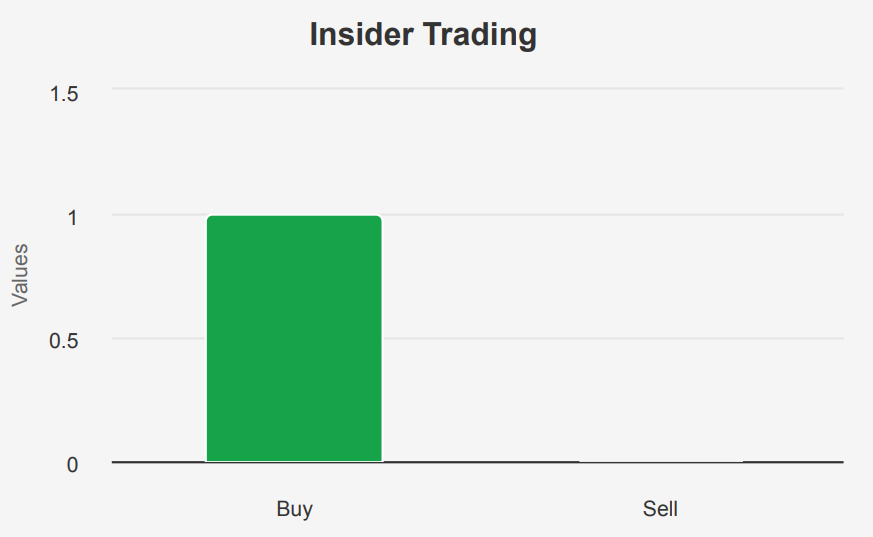
Analyzing insider trading activities under the WU stock forecast reveals limited action over the past year. In the last 12 months, there has been just one insider purchase and no sales, indicating a lack of significant insider trading activity. Over the past 6 and 3 months, there have been no reported insider buys or sells, suggesting a stable period with no immediate insider reaction to market conditions or company performance.
The insider ownership stands at 2.37%, reflecting a relatively low insider stake in the company. This could imply that the company’s directors and management may not have substantial personal financial incentives tied to share performance. On the other hand, institutional ownership is notably high at 91.20%. It indicates that the majority of the company’s shares are held by institutional investors. This high level of institutional ownership often suggests confidence in the company from professional investors, although it also means that insiders have less influence over the company’s strategic direction through shareholding.
Western Union Stock: Stable Liquidity
WU stock has an average daily trade volume of 4,138,280 shares over the past two months, indicating a relatively stable level of market participation. The current day’s trading volume of 4,288,094 shares is slightly above this average, suggesting a modest increase in trading activity. This uptick reflects the recent developments or announcements that have caught the attention of market participants.
The Dark Pool Index (DPI) for WU stands at 50.75%, indicating that just over half of the trading volume occurs in dark pools. A DPI above 50% might suggest that institutional investors play a significant role in WU’s trading activities, possibly engaging in large block trades to minimize market impact. This level of dark pool activity can also imply that there might be significant interest in the stock that is not immediately visible in the open market, potentially affecting liquidity and price discovery.
Overall, the liquidity of WU stock appears to be healthy, with sufficient trading volume to support active trading.
Navigating Fluctuations: Western Union’s Contract Revenue Trends
The data shows an upward trend in government contracts for WU from 2019 to 2023, peaking at 916,159 in 2020. Despite a slight dip in 2021, the amount gradually increased, reaching 897,866 in 2023. However, projections for 2024 indicate a decrease to 844,680. This suggests a potential stabilization in funding levels or a shift in government priorities. WU should explore diversification or efficiency improvements to counteract this anticipated reduction in contract amounts.
Declining U.S. Patent Filings: A Trend Analysis
Western Union has seen a fluctuating trend in U.S. patent filings from 2019 to 2024. The number of patents peaked at 19 in 2019, followed by a decline to 12 by 2021. A slight recovery occurred in 2022 with 14 patents, but filings reduced again to 9 in 2023. The downward trajectory continues into 2024, with only 7 patents filed, indicating a potential reduction in innovative activity or strategic shifts in intellectual property focus.
Bipartisan Moves: Congress Trades Signal Stock Sentiments
The recent trades in Congress involving Western Union stock include sales by both Kathy Manning and Tommy Tuberville. On June 13, 2024, Democratic Representative Kathy Manning from the House of Representatives reported selling between $1,001 and $15,000 worth of WU shares. This transaction was disclosed on July 6, 2024. Meanwhile, Republican Senator Tommy Tuberville completed a full sale of WU stock on April 4, 2024, also valued within the $1,001 to $15,000 range. His sale was reported on May 15, 2024.
These trades indicate a potential trend among legislators to divest from Western Union during this period. The timing of these transactions, particularly Manning’s more recent sale, may reflect broader market sentiments or specific concerns regarding the company’s performance or industry prospects. Under the WU stock forecast, it is essential to consider these trades in the context of overall market conditions and any legislative activities that might influence the financial sector.
Disclosures:
On the date of publication, Yiannis Zourmpanos did not hold (either directly or indirectly) any positions in the securities mentioned in this article. This report has been generated by our stock research platform, Yiazou IQ, and is for educational purposes only. It does not constitute financial advice or recommendations.