


Ford Stock May Benefit From Strategic Shift In Combustion and Electric Divisions
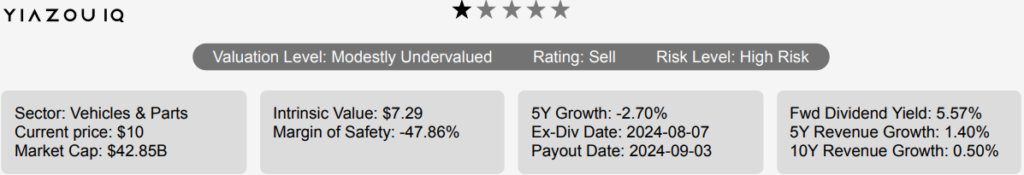
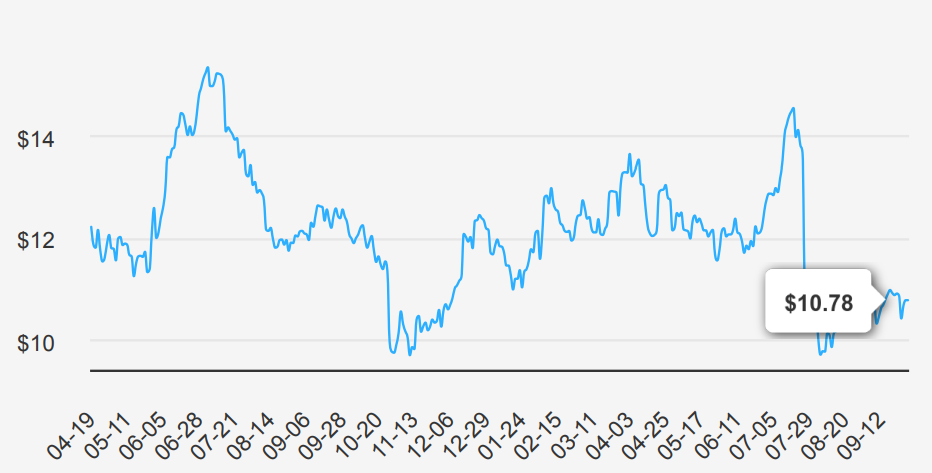
Ford Motor (F) manufactures automobiles under the Ford and Lincoln brands. In March 2022, the company announced that it would run its combustion engine business, Ford Blue, and its BEV business, Ford Model E, as separate businesses but still all under Ford Motor. The company has nearly 13% market share in the United States, about 11% share in the U.K., and under 2% share in China, including unconsolidated affiliates. Sales in the U.S. made up about 66% of 2023 total company revenue. Ford has about 177K employees, including about 59,000 UAW employees, and is based in Dearborn, Michigan. Ford stock is currently trading at nearly $11. Let’s explore why Ford stock is so low.
Ford’s Earnings Journey, Growth Amid Challenges
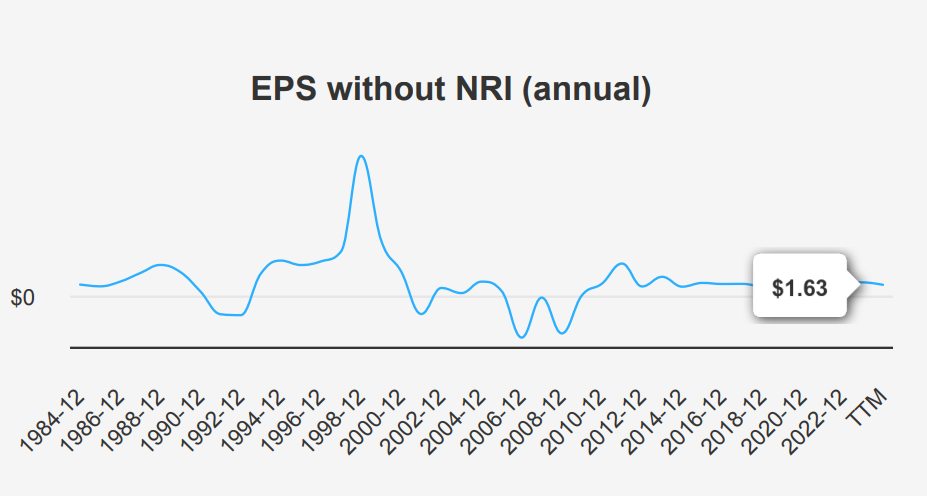
In the latest quarter ending June 30, 2024, Ford reported an EPS without NRI (Non-Recurring Items) of $0.47, reflecting a slight decline from the $0.49 recorded in the previous quarter, yet showing improvement from $0.28 in Q4-2023. Compared to the same quarter last year, EPS without NRI decreased from $0.72, indicating challenges in maintaining profitability. The diluted EPS was $0.46, up from $0.33 in Q1-2024, marking a recovery from a negative EPS in Q4-2023. Revenue per share increased to $11.887 from $10.633 in the prior quarter, signaling growth in sales. Over the past five years, the company’s annual EPS without NRI has grown at a CAGR of 15.70%, although it shows a negative 10-year CAGR of -4.10%.
Ford’s gross margin for the quarter was 8.04%, below the five-year median of 9.17% and significantly lower than the 10-year high of 12.06%. This decline in gross margins highlights potential cost pressures or pricing challenges. The share buyback ratio of 0.70 over the past year indicates that 0.7% of shares were repurchased, enhancing EPS by reducing the number of shares outstanding. The 10-year buyback ratio stands at -0.10, suggesting a net issuance of shares over the decade.
Looking ahead, Ford’s earnings outlook appears optimistic, with estimated EPS rising to $1.642 by the end of the next fiscal year and further to $1.907 in the subsequent year. Revenue estimates forecast modest growth, reaching $175,330.05 million by 2026. Industry forecasts predict an annual growth rate of approximately 4% over the next decade, driven by advancements in electric vehicles. The next earnings report is on October 25, 2024. This will provide further insights into Ford’s performance and strategic direction.
F’s Financial Performance: ROIC vs. WACC
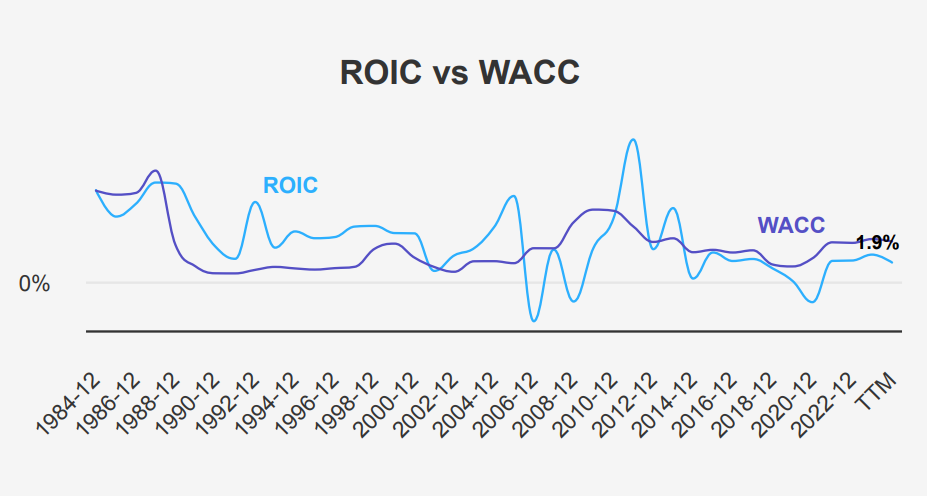
Ford’s financial performance, particularly in terms of economic value creation, is assessed by comparing its Return on Invested Capital (ROIC) with its Weighted Average Cost of Capital (WACC). Over the past five years, Ford’s median ROIC is 2.07%, consistently lower than its median WACC of 3.96%. This indicates that Ford is not generating sufficient returns to cover its cost of capital, thus failing to create economic value during this period.
In the most recent analysis, Ford’s ROIC stands at 1.90%, while the WACC is slightly higher at 4.07%. This further reinforces the trend that the company is not generating positive economic value, as the returns on its investments are not exceeding the capital costs. Such a discrepancy suggests inefficiencies in capital allocation and operational management that might be addressed to improve financial performance and shareholder value.
Ford Stock’s Dividend: Stability Amidst Financial Challenges
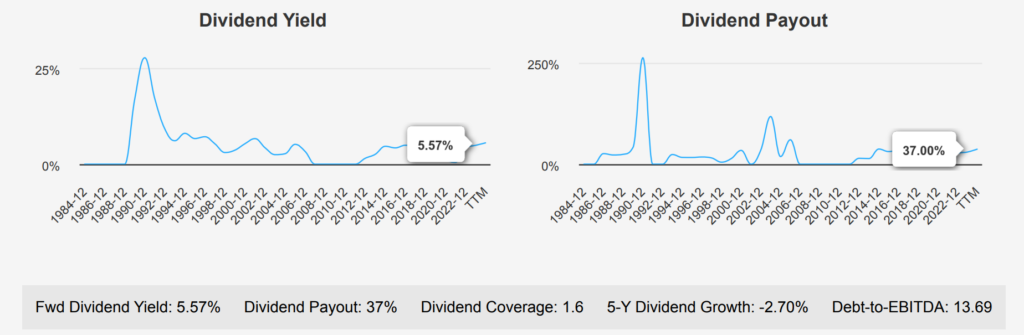
Ford’s recent dividend performance shows a mixed picture. Over the last five years, the dividend growth rate has been slightly negative at -2.70%, though the three-year growth rate is a robust 58.70%, indicating a recent recovery or acceleration in dividend payouts. F stock’s forward dividend yield stands at 5.57%, which is attractive compared to its historical median of 4.86% and suggests a favorable return for income-focused investors.
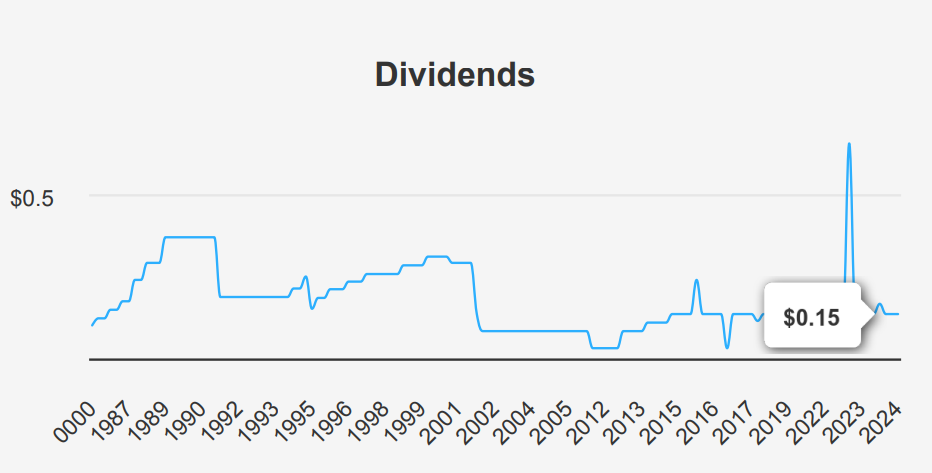
The company’s Debt-to-EBITDA ratio is notably high at 13.69, exceeding the safe threshold of 4.0, indicating heightened financial risk and potential concerns about debt servicing capacity. This high leverage could constrain future dividend increases despite the forecasted 6.20% growth rate over the next 3-5 years.
Regarding sector comparison, Ford stock’s dividend yield is competitive, though the high leverage may be a red flag against peers with lower debt levels. The next ex-dividend date is October 31, 2024.
Ford Stock’s Overvaluation and Future Potential
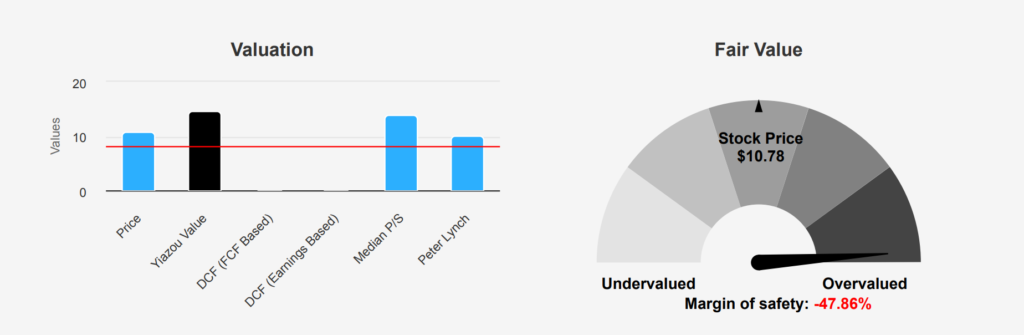
F’s current market price of $10.78 suggests an overvaluation compared to its intrinsic value of $7.29, resulting in a negative margin of safety of -47.87%. The Forward P/E ratio of 5.65 indicates the market anticipates improved earnings, but the TTM P/E ratio of 11.23 is consistent with the 10-year median of 11.24, hinting at a fair valuation relative to its historical earnings. The TTM P/S ratio is 0.24, below its 10-year median of 0.31, suggesting potential undervaluation in terms of sales.
The TTM EV/EBITDA of 14.44, slightly below the 10-year median of 15.63, indicates a reasonable valuation relative to cash earnings. However, the TTM Price-to-Free-Cash-Flow of 8.25 is above the 10-year median of 4.46, suggesting the market might be overvaluing its cash flow-generating ability. The TTM Price-to-Book ratio of 0.98 is below the 10-year median of 1.31, indicating a potential undervaluation based on book value. These mixed signals reflect an intricate valuation scenario where certain metrics suggest undervaluation while others indicate F stock’s overvaluation.
Analyst sentiment appears cautious, with the price target gradually declining over the past three months from $13.74 to $12.45. This downward trend, along with a relatively high number of analyst ratings, underscores a cautious outlook for F, potentially reflecting broader industry challenges or company-specific issues. Therefore, while some valuation metrics suggest F stock holds undervaluation in certain respects, the overall negative margin of safety and cautious analyst outlook suggest that investors should approach with caution.
Ford’s Financial Landscape: Risks and Rewards
Ford presents a mixed risk profile. On the negative side, the increase in long-term debt by $7.4 billion over the past three years raises concerns about the company’s leverage and potential strain on financial resources. The company’s history of operating income losses and lower-than-sustainable tax rates suggest its current earnings might not be fully reliable. A key reason why Ford stock is so low is its concerning financial metrics. One particularly alarming metric is the Altman Z-score of 1.06, placing Ford in the distress zone, which suggests a higher risk of bankruptcy within the next two years. Furthermore, the company’s return on invested capital is less than its weighted average cost of capital, indicating inefficiencies in how Ford utilizes its capital.
On the positive side, Ford’s financials show some strengths. The Beneish M-Score of -2.34 suggests a low likelihood of earnings manipulation, providing some reassurance regarding the reliability of its financial reporting. Valuation metrics such as the price-to-book (PB) ratio of 0.98 and price-to-sales (PS) ratio of 0.24 are close to their respective 3-year lows, indicating potential undervaluation. Moreover, the dividend yield near a 3-year high could attract income-focused investors. Overall, there are significant risks, and that’s why Ford stock is so low.
F Stock Insider Activity: A Balanced Perspective
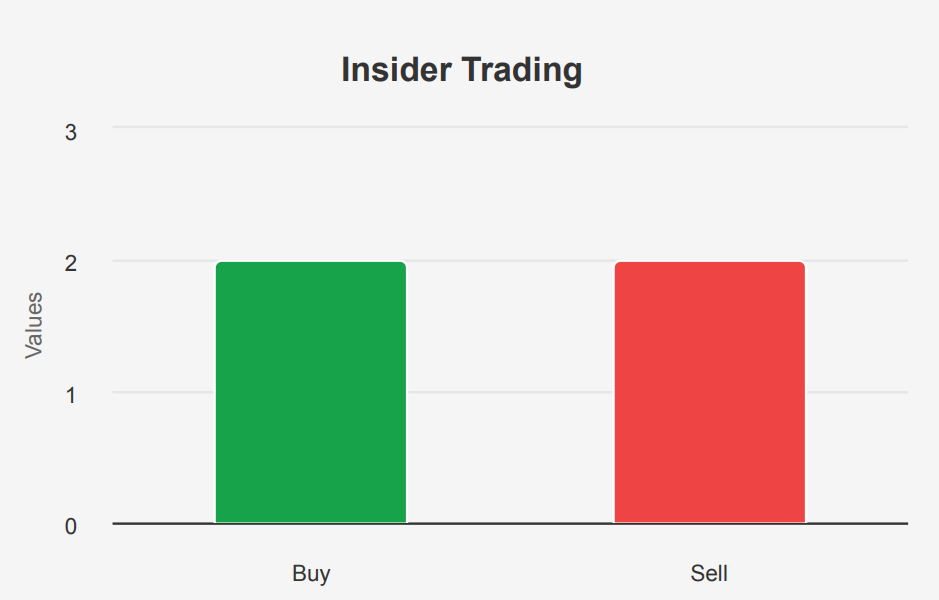
Over the past 12 months, the insider trading activity for F stock has been relatively minimal, with only two insider buys and two insider sells recorded. In the last six months, there has been one insider buy and one insider sell, and no transactions in the last three months. This limited activity suggests a neutral stance from insiders, possibly indicating a lack of significant perceived opportunities or risks within the company.
Insider ownership stands at a low 0.95%. This could imply that the company’s directors and management are not heavily invested in the company’s stock. This might suggest a lack of strong alignment with shareholder interests. On the other hand, institutional ownership is quite substantial at 58.79%, indicating strong interest and confidence from institutional investors. This level of institutional involvement often provides a stabilizing influence on the stock, suggesting that external professionals have a positive outlook on the company’s prospects. Overall, the trend suggests a cautious but stable insider sentiment towards the company’s future.
Ford Stock’s Liquidity: Insights into Market Activity
Ford Motor has exhibited significant trading activity with a daily volume of 45,011,356 shares. This is somewhat below its two-month average daily trade volume of 55,588,485 shares, indicating a recent decrease in trading activity. Despite this, the stock remains relatively liquid, facilitating ease of entry and exit for investors.
The Dark Pool Index (DPI) stands at 34.1%, suggesting that a substantial portion of the trading volume occurs off-exchange in dark pools. This level of DPI indicates moderate hidden buying or selling activity, which can sometimes lead to price movements that are less visible on traditional exchanges.
Overall, Ford’s liquidity profile is robust, supported by its high average daily volume. The slight decrease in recent trading volumes could indicate a temporary shift in investor sentiment or market conditions. The DPI value also suggests that while there is significant off-exchange trading, it is not unusually high, allowing for a balanced market perception.
Government Contracts: Peaks, Valleys, and Projections
F’s government contract revenue experienced fluctuations from 2019 to 2024. After a significant increase from $398.6 million in 2019 to $704.1 million in 2022, there was a notable drop to $320.4 million in 2023. However, projections for 2024 show a recovery to $571.7 million. This pattern suggests variability in contract acquisition or completion timing, highlighting the need for strategic planning to manage cash flow and resource allocation effectively in response to changing contract volumes.
Congressional Stock Moves: Insights into Automotive Trends
In August 2023, two significant trades involving Ford were reported by members of the U.S. Congress. On August 16, Democratic Representative Earl Blumenauer from the House of Representatives sold between $15,001 and $50,000 worth of Ford stock. The transaction was reported on September 6. Just a couple of days earlier, on August 14, Republican Senator Tommy Tuberville executed a full sale of his Ford holdings, valued between $100,001 and $250,000, which was reported on September 15.
These sales may reflect strategic reallocation of investments or reactions to market conditions. Given the timing and the similar nature of these transactions, it could suggest a shared sentiment regarding Ford’s future performance among these legislators. Such activities often draw attention as they may provide insights into potential legislative impacts on the automotive industry or broader economic predictions by influential policymakers.
Disclosures:
On the date of publication, Yiannis Zourmpanos did not hold (either directly or indirectly) any positions in the securities mentioned in this article. This report has been generated by our stock research platform, Yiazou IQ, and is for educational purposes only. It does not constitute financial advice or recommendations.