T Rowe Price Stock Represents Diverse Global Asset Management Expertise
T Rowe Price (TROW) provides asset management services for individual and institutional investors. It offers a broad range of no-load US and international stock, hybrid, bond, and money market funds. At the end of July 2024, the firm had $1.587 trillion in managed assets. This is composed of equity (51%), balanced (34%), fixed-income and money market (12%), and alternative (3%) offerings. Approximately two-thirds of managed assets are held in retirement-based accounts. This provides T Rowe Price with a somewhat stickier client base than most of its peers. The firm also manages private accounts, provides retirement planning advice, and offers discount brokerage and trust services. The company is primarily a US-based asset manager, deriving just under 9% of its AUM from overseas. T Rowe Price stock is currently trading at ~$104.

T Rowe Price Balances Earnings Dip with Long-Term Growth
In the latest quarter ending June 30, 2024, T Rowe Price reported a diluted earnings per share (EPS) of $2.11. There is a decrease from $2.49 in the previous quarter but up from $2.06 in the same quarter last year. The EPS without non-recurring items (NRI), which excludes one-time charges or gains, was $2.26. This is down from $2.38 last quarter but an increase from $2.02 year-over-year (YoY). Revenue per share was slightly lower at $7.755 compared to $7.806 in the prior quarter, yet it improved from $7.15 YoY. Over the past decade, T Rowe Price has achieved a 10-year compound annual growth rate (CAGR) of 10.70% in EPS without NRI.
T Rowe Price’s gross margin for this period stood at 50.69%, which is below its 5-year median of 57.55% and significantly lower than the 10-year high of 63.00%. The company has maintained a 1-year share buyback ratio of 0.70%. This means 0.70% of its shares were repurchased from the total shares outstanding in the past year. This buyback activity supports the EPS by reducing the share count, thereby potentially increasing the earnings attributable to each share. Over the past 5 years, the buyback ratio averaged at 1.30%, reflecting consistent capital return to shareholders.
Looking ahead, industry forecasts suggest a growth rate of approximately 6% annually over the next decade, providing a positive backdrop for T Rowe Price’s operations. Analysts estimate the company’s EPS to reach $8.97 by the end of the next fiscal year. Revenue may increase steadily, with projections of $7,160.85 million in 2024 rising to $7,790.12 million by 2026.

Consistently Beating Cost of Capital
T Rowe Price demonstrates strong financial performance and sharp capital allocation by consistently generating returns exceeding capital costs. The company’s 5-year median Return on Invested Capital (ROIC) of 27.51% is significantly higher than its 5-year median WACC of 8.81%. This positive spread indicates that T Rowe Price is creating substantial economic value. It efficiently uses its capital to generate returns that surpass the cost of funding its operations.
Even with the current ROIC at 17.31%, which is lower than the historical median but still above the current WACC of 12.48%, T Rowe Price continues to create positive economic value. This ability to maintain an ROIC above WACC across different periods and market conditions underscores the company’s robust financial health and strategic prowess.
Overall, T Rowe Price’s performance metrics suggest a well-managed entity capable of delivering value to shareholders. This is evidenced by its strong return on equity and efficient utilization of invested capital.

TROW Is Attached With a Dividend Yield of 4.8%
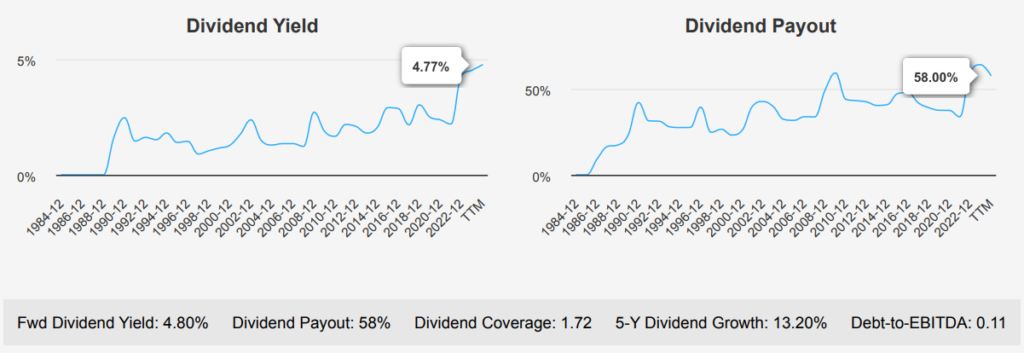
T Rowe Price has demonstrated consistent dividend growth over the past few years, with a 5-year growth rate of 13.20% and a 3-year rate of 10.70%. The latest dividend per share increased to $1.24 from $1.22, indicating ongoing, albeit modest, growth. The forward dividend yield stands at 4.8%, which is competitive within the financial services sector.

The company’s debt-to-EBITDA ratio is impressively low at 0.11, indicating minimal financial leverage and strong capacity for debt servicing. This low ratio substantially reduces financial risk compared to sector norms.
Despite the strong historical growth, the future 3-5-years dividend growth rate estimate is just 2.26%, suggesting a slowdown. This could be attributed to the high dividend payout ratio, which sits at 58%, and historical payout levels reaching above 100%, potentially limiting further increases.
The next ex-dividend date is September 13, 2024, aligning with the regular quarterly cycle. In summary, T Rowe Price maintains a robust dividend yield and low financial risk. However, past payout practices and modest forecasted increases may constrain its future growth.
T Rowe Price Stock Is Undervalued with Strong Margin
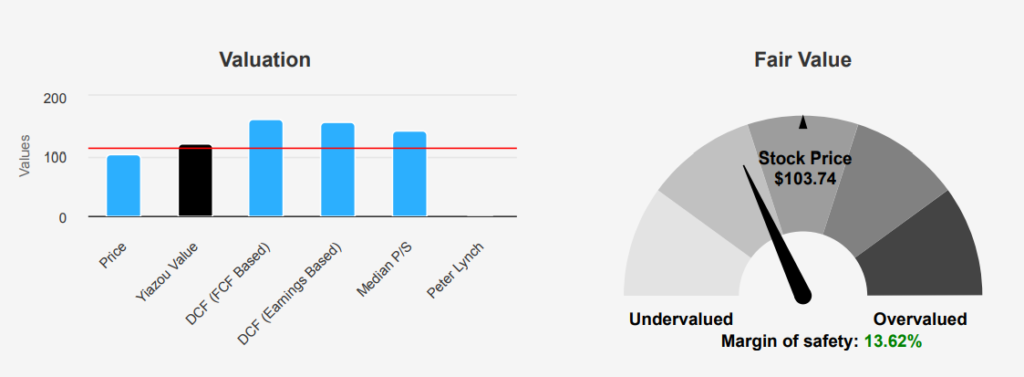
T Rowe Price currently trades at $103.74, below its intrinsic value of $120.1, suggesting a margin of safety. This indicates that T Rowe Price is undervalued based on intrinsic valuation metrics. It is providing investors with a potential buffer against market volatility. The Forward P/E ratio of 11.39 is below its 10-year median of 15.36, further supporting the notion of undervaluation. The TTM P/E ratio stands at 12.25, closer to its 10-year low of 8.63 than its high of 20.32. This indicates that the stock is priced attractively relative to its historical earnings multiples.
The TTM EV/EBITDA ratio shows that T Rowe Price is at 7.33, below its 10-year median of 9.43 but above the low of 6.12. It suggests room for potential appreciation as market conditions stabilize. The TTM Price-to-Free-Cash-Flow ratio at 18.67 is slightly below the 10-year median of 19.56. This reinforces a fair valuation for cash flow generation. The TTM Price-to-Book ratio at 2.33 is notably lower than its median of 3.85. This points to highlighting a potential undervaluation of assets relative to the market.
Analyst sentiment provides a cautious outlook, with recent price target adjustments trending downward from $116.9 three months ago to $113.9. It reflects tempered expectations in the short term. However, the overall valuation metrics suggest that T Rowe Price is undervalued compared to its historical averages. This is potentially providing a compelling entry point for value-focused investors. As such, the stock offers a reasonable margin of safety, making it an attractive consideration for long-term growth amidst fluctuating market conditions.
Balancing Risk and Reward
T Rowe Price presents a nuanced risk profile. On the downside, the company’s total assets have grown faster than its revenue, indicating potential inefficiency. Additionally, the gross and operating margins are in decline, at rates of -2.5% and -5.1% per year, respectively. This signals operational challenges. The recent insider selling with no corresponding buying activity could also suggest a lack of confidence by those closest to the company’s operations.
Conversely, T Rowe Price’s financial health remains robust in many areas. The Piotroski F-Score of 8 suggests a healthy financial situation, while the company’s interest coverage indicates it can comfortably meet its debt obligations. The Beneish M-Score and Altman Z-Score further underscore a low risk of earnings manipulation and bankruptcy. Valuation metrics such as the Price-to-Book (PB), Price-to-Earnings (PE), and Price-to-Sales (PS) ratios are near historical lows, suggesting potential undervaluation. With strong financial strength and predictable revenue and earnings growth, T Rowe Price appears fundamentally sound despite margin pressures
T Rowe Price Stock Insider Activity: Selling Surge
The insider trading activity for T Rowe Price over the past year shows a clear trend of selling among the company’s directors and management. In the last 12 months, there have been 11 insider sales and no insider buys. It indicates a consistent disposition to sell shares rather than acquire them. This pattern is evident over shorter periods, with 4 sales in the past 6 months and 3 in the last 3 months, further underscoring this trend.
Insider ownership stands at 8.14%, suggesting that insiders hold a moderate stake in the company, which might influence their decision-making regarding stock transactions. Meanwhile, institutional ownership is significantly higher at 73.25%. This indicates a strong institutional presence and potentially more stock price stability due to institutional investors’ typically long-term focus.
The absence of insider purchases could imply a lack of confidence in immediate growth or valuation, though it might also reflect personal liquidity needs or diversification strategies among insiders.

T Rowe Price Stock Is Trading With Liquidity and Dark Pools
T Rowe Price demonstrates moderate liquidity and trading activity in the market. The daily trading volume stands at 1,060,507 shares, slightly below the two-month average of 1,120,521 shares. This suggests consistent, albeit slightly declining, interest from investors in the short term.
The Dark Pool Index (DPI) for T Rowe Price is 53.27%, indicating that over half of the trades are executed in dark pools, which are private exchanges or forums for securities trading. This level of dark pool activity suggests that a significant portion of T Rowe Price’s trading is occurring away from public exchanges, potentially impacting price transparency and market liquidity.
Overall, T Rowe Price’s trading metrics reflect a stable yet cautious market interest, with dark pool trades constituting a notable portion of its market activity.
Stable Government Contracts with Notable 2019 Dip
T Rowe Price’s government contracts over the years indicate consistent engagement with public sector work. The total $11,600,000 suggests a stable revenue stream from these contracts, potentially reflecting T Rowe Price’s strong reputation and capability to fulfill government requirements. There was a decrease in contract values in 2019, which might warrant a deeper investigation to understand the underlying causes and address any potential gaps in securing future contracts.
Congress Members’ Divergent Moves on T Rowe Price Stock
On October 5, 2022, Senator Tommy Tuberville, a Republican from the Senate, executed a full sale of his T Rowe Price holdings. The transaction amount was reported between $1,001 and $15,000, reflecting a divestment strategy or possibly a portfolio rebalancing decision. In contrast, Representative Michael K. Simpson, a Republican in the House of Representatives, made a significant move by purchasing T Rowe Price shares on August 3, 2022. His investment was valued between $15,001 and $50,000. This purchase suggests a positive outlook on T Rowe Price’s performance or an alignment with his long-term investment strategy.
