


SentinelOne’s Business Model and Market Position
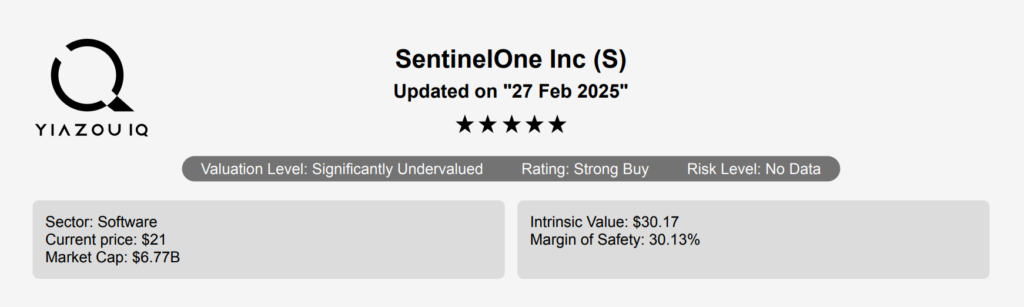
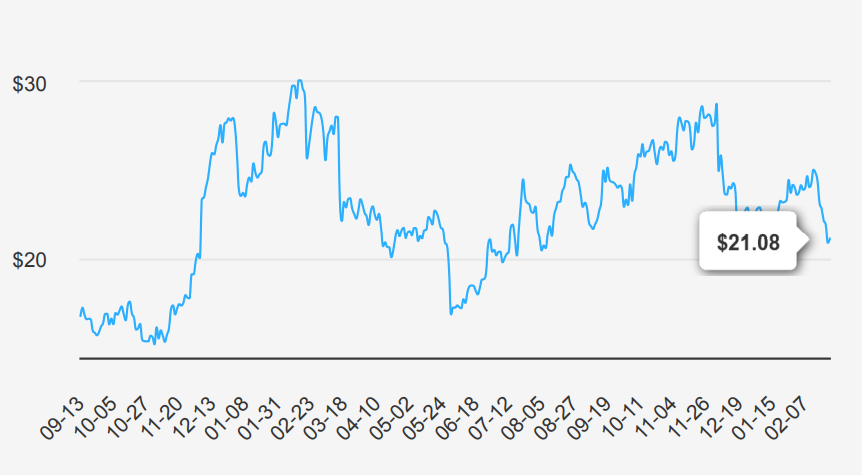
SentinelOne is a cloud-based cybersecurity company specializing in endpoint protection. SentinelOne’s primary offering is its Singularity platform, which offers a single pane of glass for an enterprise to detect and respond to security threats attacking its IT infrastructure. The California-based firm was founded in 2013 and went public in 2021. SentinelOne stock is currently trading ~$21.
SentinelOne’s Revenue Rises, But EPS Growth Stalls
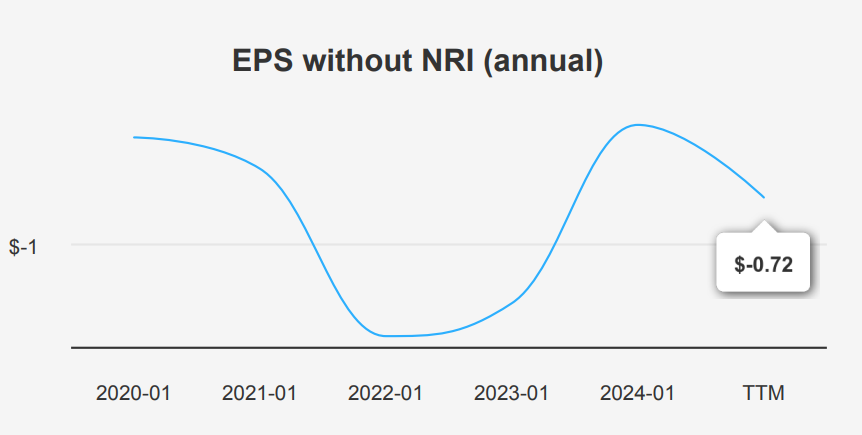
In the latest quarter ending October 31, 2024, S reported an EPS without NRI (excludes non-recurring items) of -$0.25, compared to -$0.22 in the previous quarter and -$0.24 in the same quarter last year. This reflects a slight deterioration in earnings performance both quarter-over-quarter (QoQ) and year-over-year (YoY). Revenue per share increased to $0.665 from $0.636 last quarter and $0.553 a year earlier, indicating steady growth in sales. However, the company’s EPS growth over the past five and ten years has stagnated with a 0% compound annual growth rate (CAGR). The industry, on the other hand, may grow at an annual rate of ~6% over the next decade, according to current online forecasts.
Gross margin for the quarter stood at 73.72%, which is the highest in the past ten years, significantly above the 10-year median of 60.56%. Despite strong margin performance, the company has not actively engaged in share buybacks, as indicated by a 10-year share buyback ratio of 0%. The recent negative buyback ratio of -7.5% indicates an increase in shares outstanding, potentially diluting earnings per share (EPS). The negative buyback ratio shows that instead of buying back shares, the company has issued more shares, which can impact EPS negatively unless offset by substantial earnings growth.
Looking forward, analysts estimate the next fiscal year’s EPS will be -$0.907, with an improvement expected in the following year at -$0.720. Revenue may grow significantly, with estimates reaching $1,253.84 million by 2027. The next earnings report is on March 12, 2025. Analysts’ forecasts suggest a focus on revenue growth as a driver for future performance, with the expectation of improving margins and possibly stabilizing EPS if operational efficiencies are realized.
ROIC and ROE Highlight SentinelOne’s Value Destruction
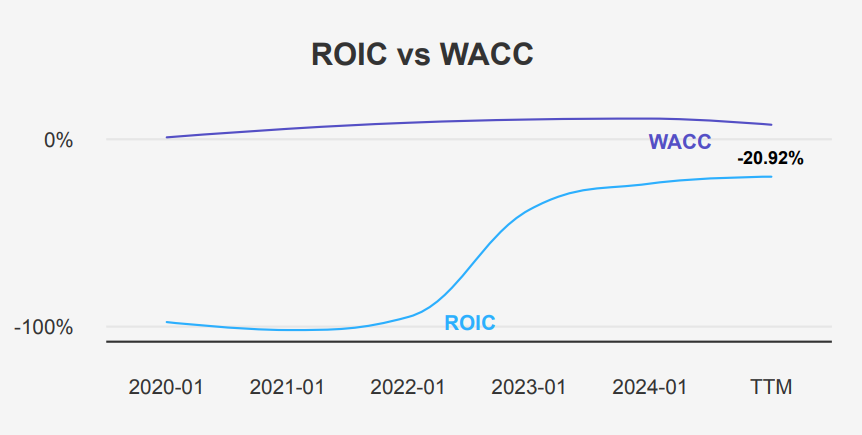
Company S’s financial performance over the past five years indicates significant challenges in capital efficiency and value creation. The company’s Return on Invested Capital (ROIC) has consistently been negative, with a five-year median of -95.47% and a current ROIC of -20.92%. This is starkly below the Weighted Average Cost of Capital (WACC), which has a five-year median of 8.64% and currently stands at 6.71%. The negative ROIC substantially below the WACC suggests that the company is destroying value, as it is not generating sufficient returns to cover its cost of capital.
Moreover, the Return on Equity (ROE) has also been negative, with a five-year median of -22.90% and a current ROE of -17.96%, indicating that the company is not effectively utilizing shareholders’ equity to generate profits. These metrics highlight ongoing inefficiencies in capital allocation and underline the need for strategic changes to improve operational efficiencies and financial performance. Overall, the substantial gap between ROIC and WACC points to significant economic value destruction.
SentinelOne Stock’s 30% Discount—Bargain or Trap?
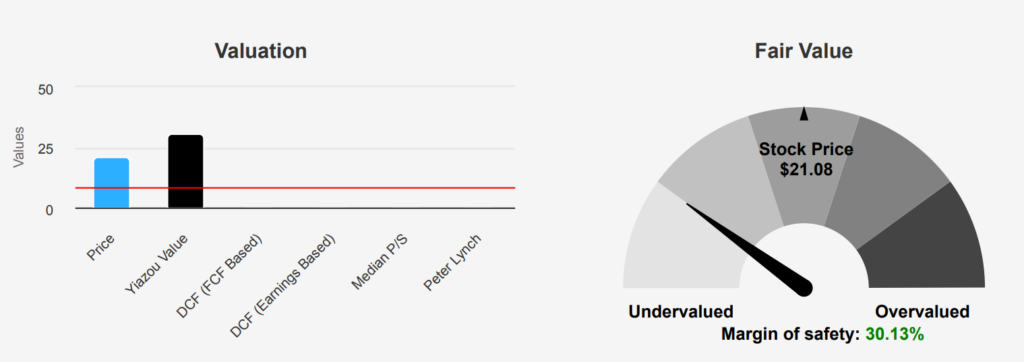
The valuation update for SentinelOne stock reveals a significant intrinsic value of $30.17 compared to its current market price of $21.08, indicating a margin of safety of 30.13%. This suggests that the stock holds undervaluation, offering a potential buffer for investors. The Forward P/E ratio stands at a lofty 107.01, highlighting expectations of substantial future earnings growth but also reflecting market optimism or potential risk. Historical P/E ratios have been at a loss, indicating past profitability challenges. The current Price-to-Sales (P/S) ratio is 8.43, which is below the 10-year median of 11.20, suggesting a more reasonable pricing relative to sales compared to its historical average.
The EV/EBITDA ratio is currently -25.25, which, although negative, falls within historical norms between -82.47 and -8.81. This negative metric suggests ongoing challenges in generating positive earnings before interest, taxes, depreciation, and amortization. The Price-to-Book (P/B) ratio sits at 4.12, near the 10-year median of 4.27, indicating that the stock is in line with its historical book value metrics. This stability in P/B ratio contrasts with more volatile earnings metrics, suggesting that the company maintains a consistent asset valuation.
Finally, the Price-to-Free-Cash-Flow (P/FCF) ratio is extremely high at 1393.98, slightly below the 10-year median but indicative of substantial cash flow valuation challenges. Despite these mixed valuation metrics, analyst sentiment appears cautiously optimistic, as suggested by the steady price target of approximately $29.38, slightly below the calculated intrinsic value. This overall analysis suggests a complex outlook where S might be undervalued based on intrinsic value, but high forward-looking multiples necessitate a cautious approach.
SentinelOne Stock Insider Selling and Financial Stability—Conflicting Signals
The recent insider selling activity at SentinelOne Inc, with 15 transactions totaling 745,283 shares over the past three months, poses a cautionary signal. Such significant selling without any corresponding insider purchases might suggest potential concerns about the company’s short-term outlook or overvaluation from an insider perspective. This could indicate that insiders foresee potential headwinds or a lack of near-term growth catalysts.
Despite this, SentinelOne’s financial health appears robust. The Beneish M-Score of -2.85 suggests the company is unlikely to be manipulating its financial results, enhancing trust in its reported figures. Moreover, with a strong Altman Z-Score of 4.73, SentinelOne holds financial stability, indicating a low risk of bankruptcy in the near future. The strong balance sheet ranking further supports the company’s solid financial foundation, suggesting resilience against economic fluctuations.
Overall, while the insider selling may raise some concerns, the company’s sound financial metrics provide reassurance of its longer-term viability. Investors should weigh these factors carefully, considering both the insider activity and the strong financial indicators when assessing the risk associated with SentinelOne Inc.
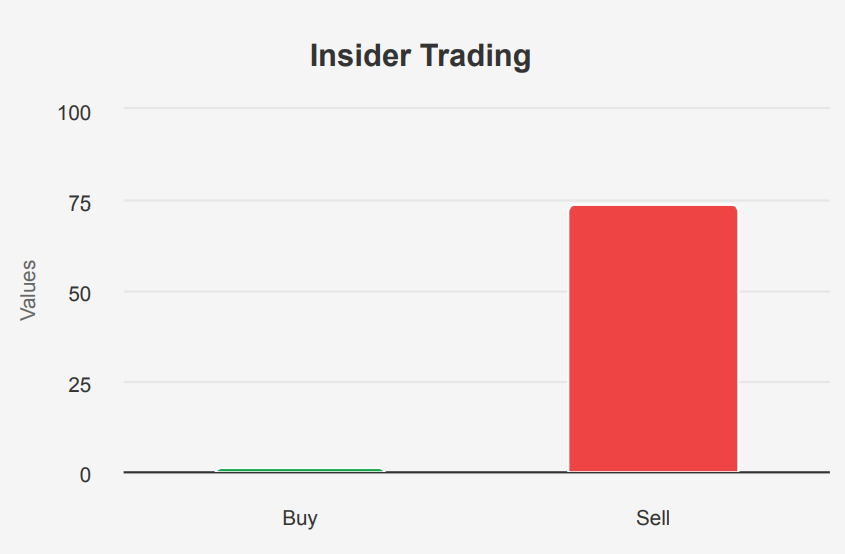
74 Insider Sales, Only 1 Buy—A Warning Sign For SentinelOne Stock?
Analyzing insider trading trends for SentinelOne stock reveals a consistent pattern of selling activity among insiders over the past year. Within the last three months, there have been 16 insider sell transactions and no insider buys, suggesting a lack of confidence or a strategic decision by insiders to liquidate shares. Extending the analysis to six months, the trend continues with 34 sell transactions and still no buys, while over the entire year, there was only one buy against 74 sells.
Insider ownership stands at a low 1.32%, indicating limited vested interest by insiders in holding onto company shares, which can sometimes signal their perception of the company’s future performance. In contrast, institutional ownership is significantly high at 77.44%, indicating strong institutional interest or belief in the company’s prospects. The disparity between high institutional ownership and low insider buying may suggest differing perspectives on the company’s valuation or future outlook. This heavy insider selling trend warrants caution and further investigation into the reasons behind these transactions.
SentinelOne’s Dark Pool Activity and Market Liquidity
The liquidity and trading analysis for S reveals several key insights. The average daily trading volume over the past two months is ~3,824,054, which indicates a relatively active trading environment. Comparing this to the current daily volume of 3,438,516, there is a slight decline in trading activity, suggesting a minor decrease in liquidity.
The Dark Pool Index (DPI) stands at 44.53%, which indicates that a significant portion of trades are occurring in dark pools rather than on public exchanges. This can imply both potential advantages and drawbacks. On the one hand, it suggests that larger trades have less impact on the public price, which could help maintain price stability. On the other hand, a high DPI value may lead to reduced transparency regarding the actual supply and demand dynamics, making it harder for the average investor to gauge market sentiment.
Overall, while the trading activity is slightly below the recent average, the high DPI percentage suggests that institutional players may be actively engaging in off-exchange transactions, which could impact general market visibility.
Lawmakers’ Mixed Sentiment on SentinelOne Stock
The most recent trade involves Senator Thomas R. Carper, a Democrat from the Senate, who executed a full sale of a stock with the ticker “S” on January 2, 2024. The transaction was reported on February 2, 2024, and fell within the range of $1,001 to $15,000. The trade resulted in an excess return of -44.49% compared to the S&P 500’s gain of 25.98% during the same period, highlighting a significant underperformance. The price of the stock declined by 18.52% since the transaction date.
In contrast, a historical trade by Representative Gary Palmer, a Republican from the House of Representatives, was a purchase of the same ticker “S” on April 4, 2017. This transaction was reported on September 29, 2018, with a similar value range. The price of the stock increased by 142.86%, though it still underperformed the S&P 500’s gain of 152.89%. This suggests a positive return for Palmer, albeit less than the broader market’s performance.
Disclosures:
Yiannis Zourmpanos has a beneficial long position in the shares of S either through stock ownership, options, or other derivatives. This report has been generated by our stock research platform, Yiazou IQ, and is for educational purposes only. It does not constitute financial advice or recommendations.