


Realty Income’s Expanding 15,400-Property Portfolio Across 47 Industries
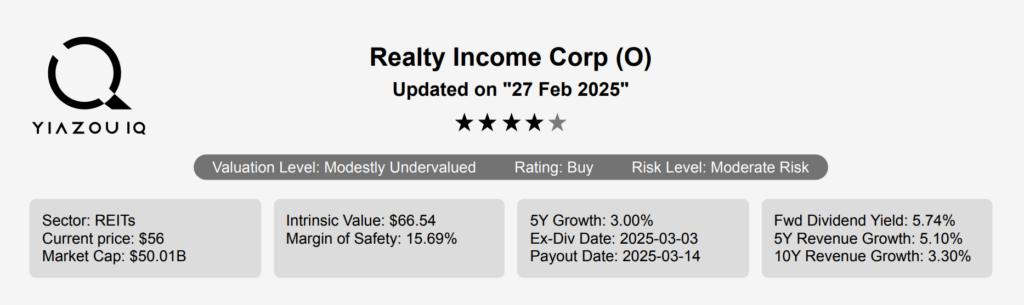
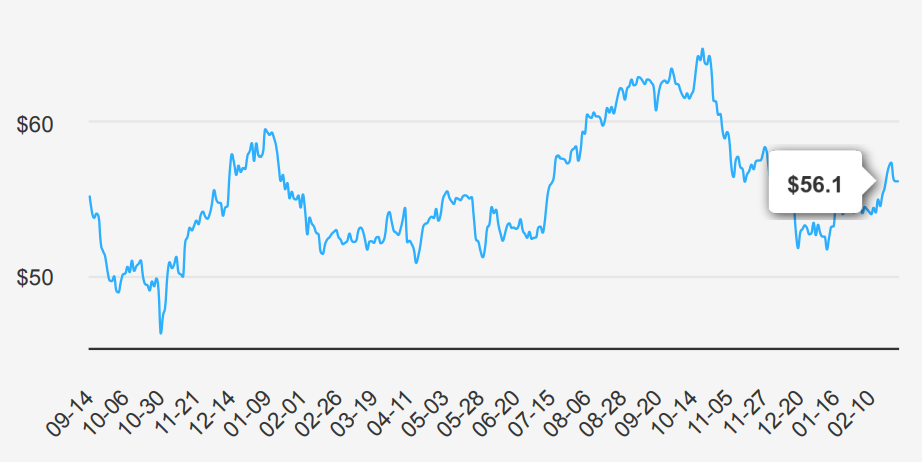
Realty Income owns roughly 15,400 properties, most of which are freestanding, single-tenant, triple-net-leased retail properties. Its properties are located in 49 states and Puerto Rico and are leased to 250 tenants from 47 industries. Recent acquisitions have added industrial, gaming, office, manufacturing, and distribution properties, which make up roughly 20% of revenue. Realty Income stock is currently trading near $56.
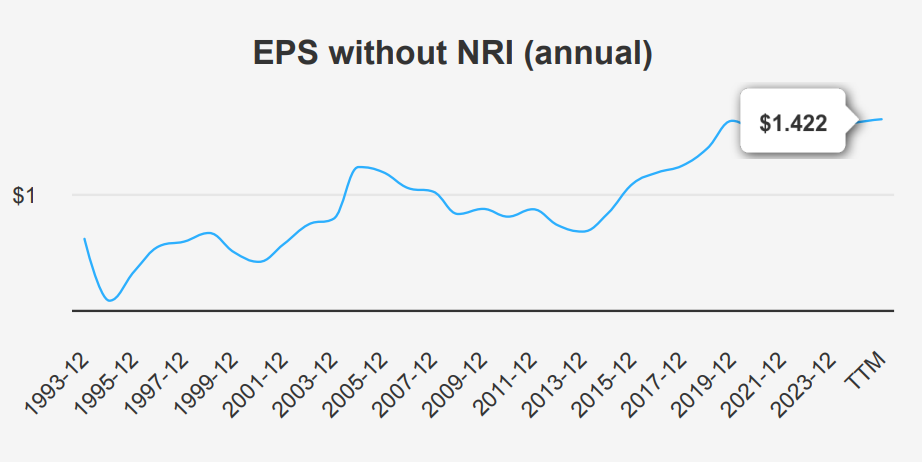
EPS Decline, 0.90% 5-Year CAGR, but Revenue Expected to Hit $6B by 2027
In the fourth quarter of 2024, O reported an EPS without NRI (excluding non-recurring items) of $0.342, slightly down from $0.361 in the previous quarter and from $0.361 the same quarter last year. The EPS (Diluted) showed a more significant decline to $0.23 from $0.3 both in the previous quarter and the corresponding quarter of the prior year. Revenue per share remained relatively stable at $1.524, a slight increase from $1.483 in Q4 2023. Over the past five years, the company’s annual EPS without NRI has grown at a compound annual growth rate (CAGR) of 0.90%, and 5.60% over ten years, indicating modest long-term growth.
The company’s gross margin for Q4 2024 was 92.84%, slightly below its 5-year median of 93.58% and the 10-year median of 94.14%. This marginal decrease suggests minor pressure on profitability despite maintaining high margins typical for its industry. The share buyback ratio over the past year was -20.90%, indicating a reduction in outstanding shares by approximately 20.9%. This strategy has helped support the EPS, as fewer shares outstanding tend to boost EPS figures.
Looking forward, analysts estimate a revenue growth to $5,410.21 million by the end of 2025 and $6,046.05 million by 2027, signaling a positive outlook for the company. The next projected earnings release is on May 6, 2025, with an estimated EPS of $1.629 for the fiscal year, suggesting continued growth. Industry forecasts indicate a steady growth trajectory over the next decade, positioning O favorably in its sector.
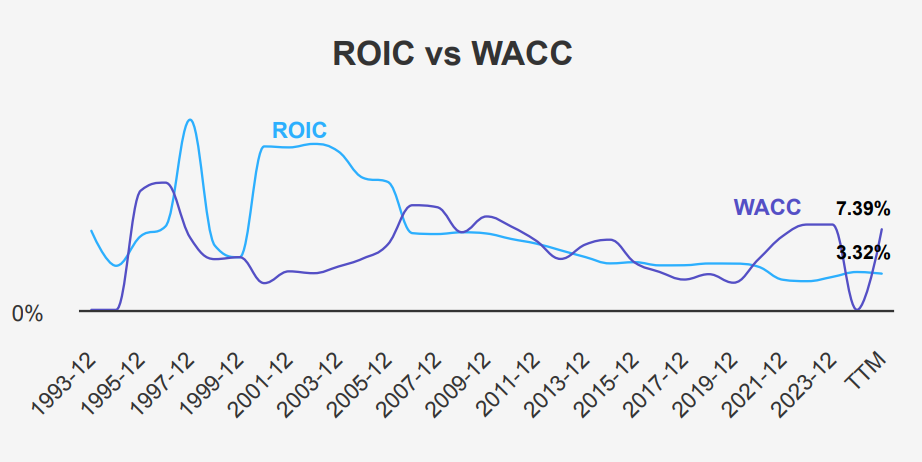
ROIC at 3.28% vs. WACC at 7.39% – Value Creation Concerns
O’s financial performance, in terms of value creation, can be effectively gauged by comparing its Return on Invested Capital (ROIC) with its Weighted Average Cost of Capital (WACC). The company’s ROIC over the last five years has a median of 3.02%, with a current ROIC of 3.28%. This indicates a slight improvement over its historical median. However, both figures fall short when compared to the five-year median WACC of 6.78% and the current WACC of 7.39%.
When ROIC is less than WACC, it suggests that the company is not generating sufficient returns on its capital to cover its cost, thereby destroying value rather than creating it. In this scenario, O’s capital allocation does not appear to be efficient as it is not yielding returns above its cost of capital. This indicates the need for the company to either improve operational efficiencies, optimize its capital structure, or strategically reallocate its capital to enhance shareholder value and achieve a ROIC that surpasses its WACC.
Realty Income Stock: 5.74% Yield, 224% Payout Ratio – Sustainable or Risky?
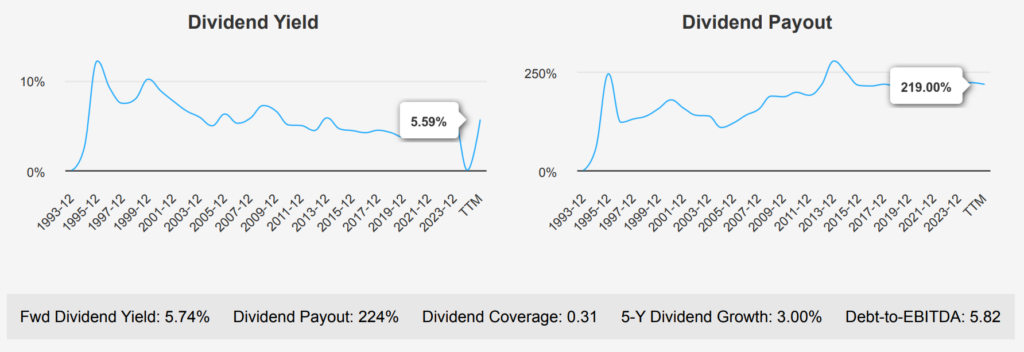
In the most recent quarter, O has shown a steady dividend growth, with the dividend per share (DPS) increasing from $0.2635 in October 2024 to $0.268 by March 2025, maintaining a consistent growth trajectory that aligns with its 5-year and 3-year average growth rates of 3.00%. The company boasts a forward dividend yield of 5.74%, which is attractive against its historical median yield of 4.56%.
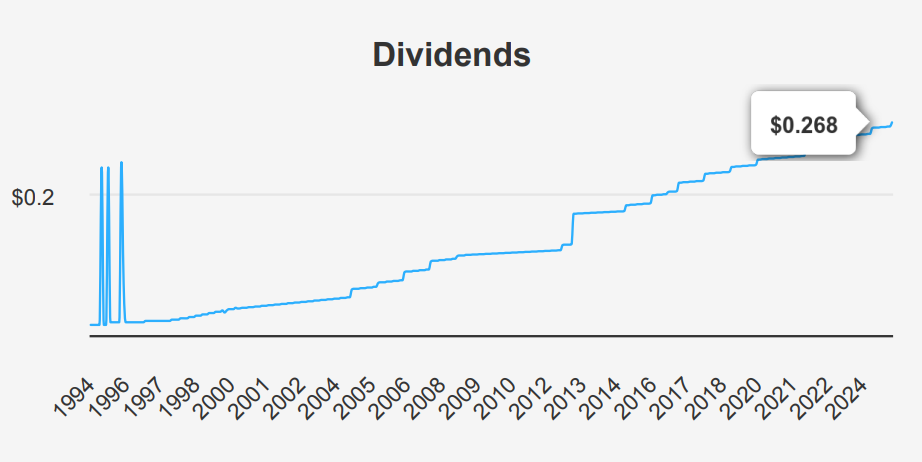
However, the high dividend payout ratio of 224% raises concerns, as it significantly exceeds its historical median of approximately 102%, indicating potential sustainability issues if earnings do not increase. The sector comparison reveals that O’s Debt-to-EBITDA ratio of 5.82 is relatively high, suggesting increased financial risk and potential challenges in managing debt.
The forecasted 3-5 year dividend growth rate is at 5%, which, if realized, could provide investors with continued income growth, although this depends on the company managing its financial leverage effectively.
Given the next ex-dividend date of March 3, 2025, which aligns with a Monday, it is suitable for dividend investors planning their portfolios. This future date suggests the company maintains its consistent monthly dividend schedule, supporting investor confidence in regular income distribution.
15.69% Undervalued – Opportunity or Justified Discount On Realty Income Stock?
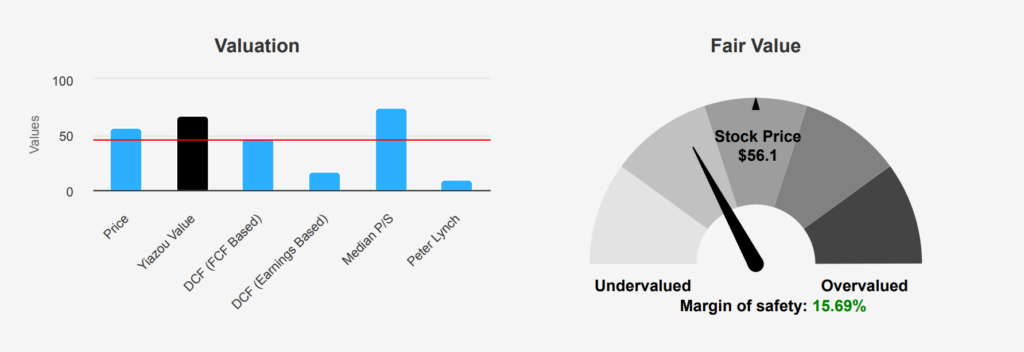
The intrinsic value of O stands at $66.54, whereas the current market price is $56.10, indicating a margin of safety of approximately 15.69%. This suggests that Realty Income stock holds undervaluation based on its intrinsic value, offering investors a potential buffer against market volatility. The Forward P/E ratio of 35.39 is lower than the trailing twelve months (TTM) P/E ratio of 57.24, reflecting expectations of earnings growth. Historically, the P/E ratio has fluctuated between a high of 76.16 and a low of 28.92 over the past decade, with the current figures suggesting a moderate valuation in comparison.
Examining the TTM Price-to-Sales (P/S) ratio, currently at 9.19, it approaches the lower end of its 10-year range of 8.44 to 16.96, indicating a more conservative valuation relative to sales. The EV/EBITDA ratio is 17.59, which is lower than its 10-year median of 20.06, pointing to a potentially favorable valuation compared to historical norms. The Price-to-Book (P/B) ratio of 1.29 is near its 10-year low of 1.12, suggesting undervaluation relative to the company’s book value. These metrics collectively position O as potentially undervalued in contrast to its historical performance.
Analyst sentiment towards Realty Income stock reflects a moderate outlook, with the price target recently adjusted to $60.44 from $63.53 three months ago, indicating tempered expectations. The number of price targets and analyst ratings suggests ongoing interest and analysis, though the gradual decrease in price targets over recent months reflects cautious optimism. Despite this, the intrinsic value assessment and key valuation ratios indicate a potential buying opportunity for long-term investors seeking a margin of safety.
High Debt, Low ROIC, but Stable Revenue Growth
Realty Income Corp’s financial risk profile presents several concerns. The company’s long-term debt issuance of $7.1 billion over the past three years raises questions about its leverage and financial stability. Coupled with an Altman Z-score of 1, Realty Income Corp is in the distress zone, suggesting a potential risk of bankruptcy within two years. The company’s operating margin has consistently declined over the past five years, indicating deteriorating operational efficiency. Furthermore, the return on invested capital falling below the weighted average cost of capital suggests inefficient capital utilization.
The company’s asset growth rate of 34.5% annually, compared to a revenue growth rate of only 5.1%, implies inefficiencies in asset utilization. The high dividend payout ratio of 2.23 raises concerns about the sustainability of its dividends, especially with insider selling activity noted in the past three months. Despite these risks, Realty Income Corp shows some positive indicators. Its M-Score suggests low risk of financial manipulation, and its predictable revenue growth, alongside a price-to-sales ratio near a 10-year low, could attract value investors. Additionally, the near 3-year high dividend yield offers some appeal to income-focused investors.
Realty Income Stock 4 Insider Sales in 12 Months – A Red Flag?
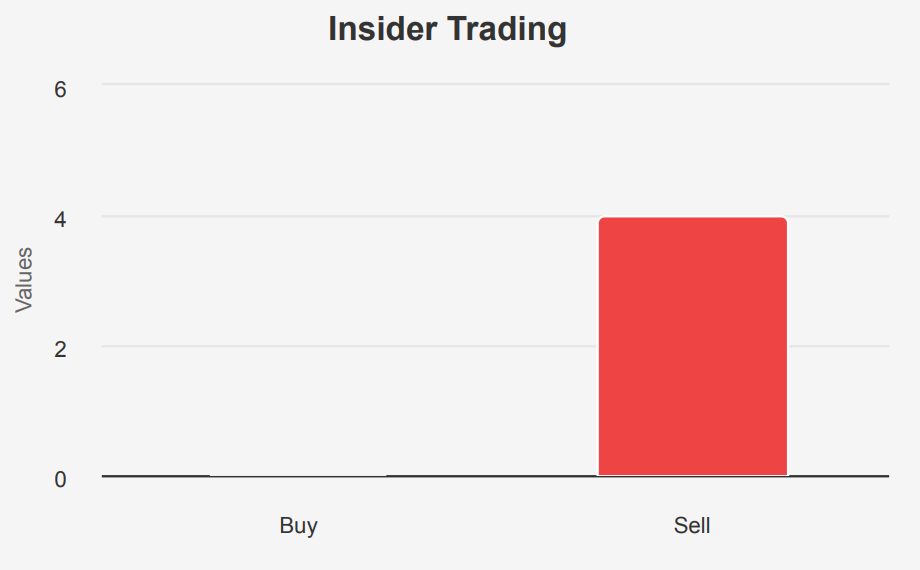
The insider trading activity for Realty Income stock over the past year indicates a consistent pattern of selling with no insider purchases. In the last three months, there has been 1 insider sale, bringing the total to 2 sales over the past six months and 4 sales in the past year. This trend suggests that insiders, such as directors and management, may perceive the stock as either fairly valued or potentially overvalued, prompting them to reduce their holdings.
Insider ownership is relatively low at 0.20%, indicating that insiders have minimal skin in the game compared to the overall equity, which may influence their decision-making and perception of the company’s future prospects. Meanwhile, institutional ownership is significantly higher at 77.71%, suggesting that large investors maintain a strong interest in the company, possibly due to differing views on its future growth potential or value.
Overall, the lack of insider buying and the ongoing selling trend may warrant a cautious outlook for potential investors, considering insiders’ potential knowledge of the company’s internal conditions.
21.8% Surge in Trading Volume – Investor Interest Rising?
Realty Income stock exhibits robust liquidity, as indicated by its current trading metrics. The daily trading volume stands at 6,053,320, surpassing its two-month average daily trade volume of 4,971,180 by approximately 21.8%. This heightened trading activity suggests increased investor interest or heightened volatility, which can be beneficial for traders looking for liquidity and tighter bid-ask spreads.
The trading volume is a critical component of liquidity analysis, as it reflects the ease with which shares can be bought or sold without causing significant price changes. With its current volume exceeding the average, Realty Income is likely experiencing strong market engagement, allowing for smoother execution of trades.
The Dark Pool Index (DPI) highlights the percentage of trades executed in dark pools, which are private exchanges for trading securities. DPI metrics provide insight into off-exchange trading activity, which is crucial for understanding market sentiment and potential hidden liquidity. However, specific DPI percentages are not provided in this analysis.
Overall, Realty Income’s liquidity profile appears solid with high trading volumes, ensuring that investors can enter or exit positions with relative ease in the current market environment.
Senator Purchases, But Realty Income Stock Underperforms – A Contrarian Signal?
Senator Gary Peters (D) from the Senate engaged in a notable purchase of stock with the ticker “O” on March 14, 2023, valued between $15,001 and $50,000. This transaction was reported on April 12, 2023. The stock underperformed compared to the market, with an excess return of -63.15% and a price change of -11.26%, while the SPY index saw a positive change of 51.89% during the same period.
Similarly, another transaction in the same stock was made on July 21, 2021, also valued between $15,001 and $50,000. This earlier purchase was reported on August 3, 2021. It too resulted in a negative excess return of -56.91% and a price change of -20.06%, against a backdrop of a 36.85% rise in the SPY index. Both transactions highlight significant underperformance relative to the broader market indices.
Disclosures:
Yiannis Zourmpanos has a beneficial long position in the shares of O either through stock ownership, options, or other derivatives. This report has been generated by our stock research platform, Yiazou IQ, and is for educational purposes only. It does not constitute financial advice or recommendations.