Realty Income Dividend: Backed By Diverse Property Portfolio and Revenue Sources
Realty Income (O) owns roughly 15,400 properties, most of which are freestanding, single-tenant, triple-net-leased retail properties. Its properties are located in 49 states and Puerto Rico and are leased to 250 tenants from 47 industries. Recent acquisitions have added industrial, gaming, office, manufacturing, and distribution properties, which make up roughly 20% of revenue. O stock is currently trading at $57.45.

Steady Growth in EPS with Modest Revenue Increase
In the latest quarter ending September 30, 2024, O’s EPS without NRI (which excludes non-recurring items) stood at $0.36, a slight decrease from $0.368 in Q2 2024 but an increase from $0.348 in Q3 2023. The diluted EPS was $0.30, consistent with Q4 2023 but slightly down from $0.33 in the same quarter last year. Revenue per share was $1.526, showing a decrease from $1.538 in the previous quarter but an improvement from $1.464 in Q3 2023. The 5-year and 10-year CAGRs for annual EPS without NRI are 0.90% and 5.60%, respectively, indicating moderate long-term growth.
Industry forecasts suggest an average growth of around 4% annually over the next decade. The company’s gross margin for the quarter was 92.75%, slightly below its 5-year median of 93.58% and the 10-year median of 94.14%. This indicates a small contraction in profitability efficiency. Notably, O’s share buyback ratio over the past year was -20.90%, meaning the company has issued more shares than it has repurchased, which can dilute EPS. Over the last decade, the buyback ratio has averaged -13.70%, reflecting a consistent trend of share issuance.
Looking ahead, analysts estimate O’s EPS will reach $1.307 for the fiscal year ending in 2025 and $1.600 for 2026, suggesting optimistic growth. Revenue may grow to $5,411.5 million by the end of 2025 and $5,745.67 million by 2026. The next earnings announcement is on February 20, 2025, which will provide further insights into the Realty income’s dividend and progress towards these targets.

Return on Invested Capital Falls Short of Capital Costs
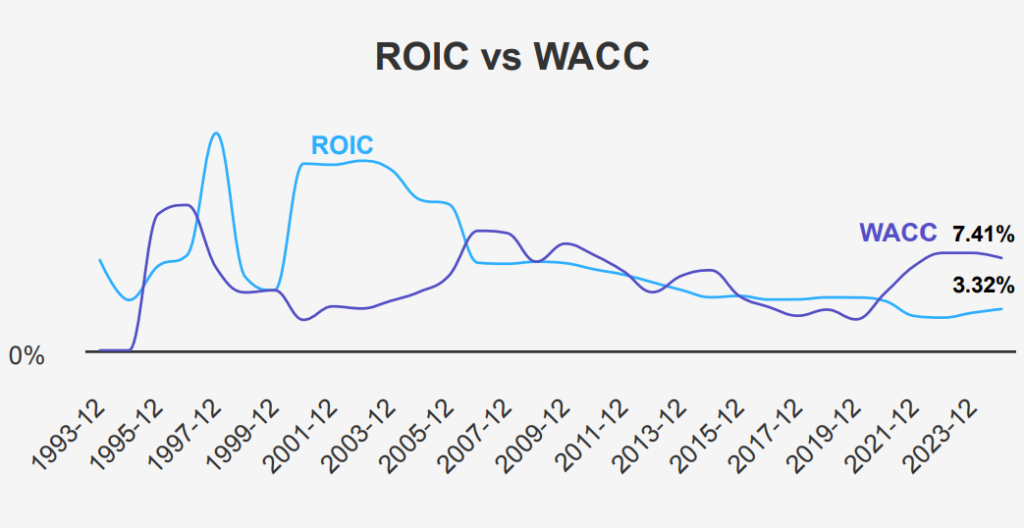
O’s financial performance, evaluated through its Return on Invested Capital (ROIC) and Weighted Average Cost of Capital (WACC), indicates a challenge in generating economic value. The company’s 5-year median ROIC is 3.02%, and its current ROIC is 3.32%, which are both significantly lower than its 5-year median WACC of 6.78% and current WACC of 7.41%. This disparity suggests that O is not effectively creating value, as it fails to cover the cost of its capital.
The ROIC should ideally be higher than the WACC to ensure that the company is not only covering its capital costs but also generating additional value for shareholders. However, the current and historical data show that O’s ROIC consistently trails its WACC. Additionally, with an ROE of 2.43%, which is also below its WACC, the company’s efficiency in capital allocation and using equity to generate profit is lacking. Without a strategic shift to improve its ROIC or reduce capital costs, O may continue to struggle to create shareholder value.
High Dividend Payouts at Risk Due to Financial Leverage
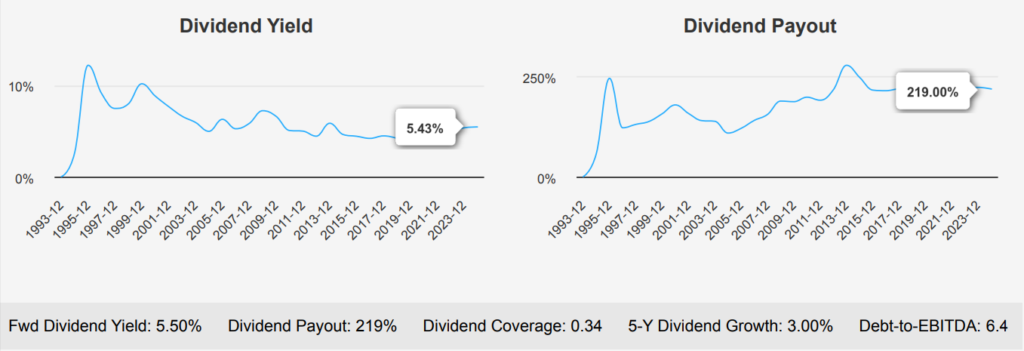
The recent dividend growth for O shows stability with a 5-year and 3-year growth rate of 3%, though the forward dividend yield of 5.50% is higher than its 10-year median of 4.55%, indicating a relatively attractive yield compared to its historical performance. The dividend payout ratio stands at a very high 219.0%, which is significantly above its historical median range, suggesting that the company is paying out more in dividends than it earns, a potential red flag for sustainability.
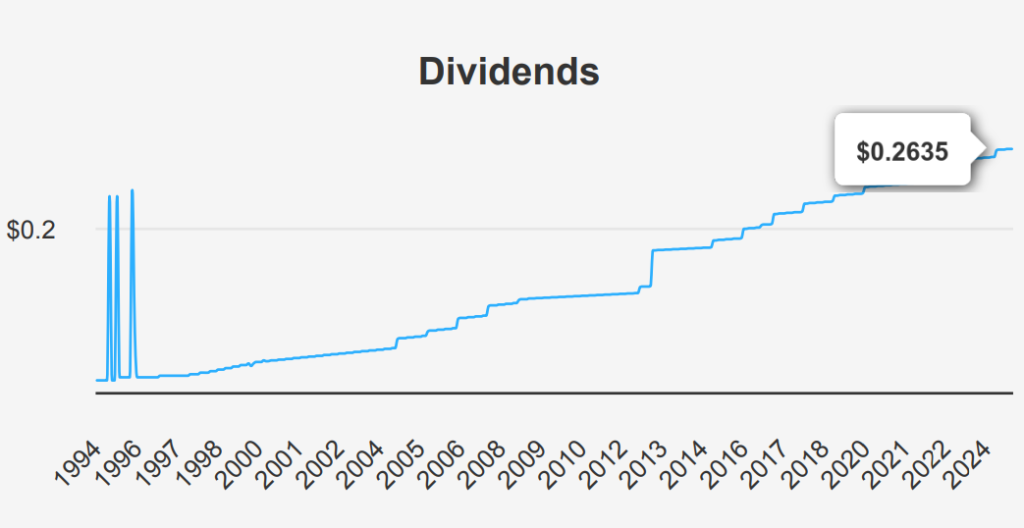
The Debt-to-EBITDA ratio at 6.40 is considerably high, indicating elevated financial risk and raising concerns regarding the company’s ability to manage its debt effectively. Typically, such a ratio may point to problems, suggesting that the company’s limited scope to increase dividends unless earnings improve or reduce debt. The forecasted dividend growth rate for the next 3-5 years is slightly lower at 2.96%, indicating expectations of modest growth. The next ex-dividend date is December 2, 2024, and based on a monthly frequency, the subsequent ex-dividend date will likely be January 2, 2025, a Thursday, given the monthly payout schedule seen in recent months.
Undervalued O Stock with Margin of Safety and Growth Potential
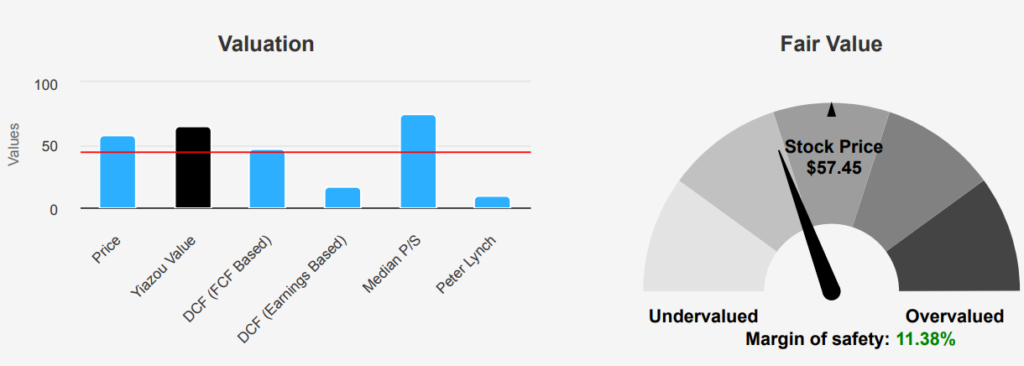
The current intrinsic value of O is $64.83, while its market price stands at $57.45, suggesting an approximate margin of safety of 11.38%. This indicates that the stock holds undervaluation, providing a buffer for investors against unforeseen risks. The Forward P/E ratio at 37 is significantly lower than the trailing twelve months (TTM) P/E of 54.71, suggesting expectations for improved earnings growth. The P/E ratio remains within its historical 10-year range, though slightly above the median of 49.66, indicating that the stock holds a price on the higher side relative to its earnings history.
Examining the TTM EV/EBITDA ratio of 18.36, it is on the lower end against the 10-year high of 28.68 and closer to the 10-year low of 15.80. This suggests a more favorable valuation relative to its enterprise value and earnings before interest, taxes, depreciation, and amortization. The TTM Price-to-Book ratio of 1.31 is notably below both the 10-year median of 2.03 and the high of 2.79, indicating that the stock may undervaluation in terms of its book value. Similarly, the TTM Price-to-Free-Cash-Flow ratio of 14.11 is below the 10-year median, reinforcing the potential undervaluation.
Analyst sentiment appears cautiously optimistic, with a slight downward adjustment in price targets over the past few months, from $64.75 to $63.72. This aligns with the intrinsic value analysis, suggesting a potential upside. Overall, O’s valuation metrics imply it is trading below its intrinsic value, with specific ratios indicating undervaluation against historical averages, presenting a potential investment opportunity.
Financial Instability Risks and Potential for Strategic Adjustments
Realty Income Corp faces significant financial risks, primarily due to its aggressive debt accumulation and declining operating efficiency. Over the past three years, it has issued $7.1 billion in new debt, raising concerns about its ability to manage long-term liabilities. This is exacerbated by a 34.5% annual growth in total assets, which outpaces its 5.1% revenue growth, suggesting inefficiencies in asset utilization. The
company’s operating margin has been decreasing by an average of 4% annually over the past five years, further indicating declining profitability.
The company’s financial health is particularly concerning given its high dividend payout ratio of 2.19, suggesting potential unsustainability in its dividend payments. Additionally, the return on invested capital (ROIC) is lower than its weighted average cost of capital (WACC), indicating inefficient capital use. The Altman Z-score of 1.04 places Realty Income Corp in the distress zone, highlighting a potential risk of bankruptcy within two years.
On a positive note, the company is unlikely engaged in financial manipulation, as indicated by a Beneish M-Score of -2.39. Moreover, Realty Income Corp has demonstrated predictable revenue and earnings growth, which could provide some stability despite the surrounding risks. However, the recent insider selling activity and lack of significant insider buying could further reflect the underlying concerns within the company.
Consistent Insider Selling In O Stock Indicates Cautious Outlook
Over the past year, insider trading activity for company O has displayed a consistent pattern of selling by insiders, with no buying activity recorded. Specifically, there have been four insider sell transactions over the past 12 months, with two occurring in the last six months and two in the last three months. This lack of buying, coupled with consistent selling, may suggest that insiders are not anticipating significant positive changes in Realty Income dividend and the stock’s short-term prospects.
Additionally, insider ownership stands at a relatively low 0.21%, indicating that the company’s directors and management hold a minimal stake in the company. This low level of insider ownership might imply a lesser degree of alignment between the interests of the insiders and those of the general shareholders.
On the other hand, institutional ownership is significantly high at 78.85%, suggesting that institutional investors have a substantial influence over the company’s decision-making processes. This could mean a potentially stable investment due to the involvement of institutional investors despite the lack of insider buying. Overall, the trend reflects cautious optimism among insiders and a dominant institutional presence.

Strong Trading Volume and Institutional Interest
The liquidity and trading analysis for the company “O” indicates a moderate level of market activity. The current daily trading volume stands at 3,262,159 shares, which is below the two-month average daily trading volume of 4,676,355 shares. This suggests a recent decline in trading activity. A lower trading volume compared to the average could imply reduced investor interest or fewer trading opportunities, which might affect liquidity and Realty Income dividend. Liquidity is crucial for investors to enter or exit positions without causing significant price changes.
The Dark Pool Index (DPI) is reported at 40.43%. A DPI of 40.43% suggests that a significant portion of the trading volume is occurring in dark pools, which are private exchanges. This level indicates that nearly half of the trading activity is not visible to the public markets, potentially influencing price discovery and transparency. Overall, the analysis highlights a potential decrease in liquidity, given the lower trading volume, and significant dark pool activity, which could impact market dynamics and investor decision-making. Investors should consider these factors when assessing the trading environment and liquidity risks associated with the stock ‘O’ and Realty Income dividend.
Senator’s Consistent Investment Signals Confidence Realty Income Dividend
In analyzing the recent and significant trades by Senator Gary Peters, we observe two notable transactions involving the purchase of securities from the company identified by ticker “O.” The most recent transaction took place on March 14, 2023, and was reported on April 12, 2023. In this instance, Senator Peters purchased stocks valued between $15,001 and $50,000. Previously, a similar transaction occurred on July 21, 2021, reported on August 3, 2021, with the same purchase range.
Both transactions were conducted in the Senate by a Democratic representative, suggesting a consistent investment strategy in this particular stock over the years. The repeated investments might indicate a confidence in the company or sector’s growth potential, reflecting the senator’s ongoing commitment to this asset. Such activities are crucial for understanding the financial inclinations and potential conflicts of interest in congressional members’ trading behaviors.
Disclosures:
Yiannis Zourmpanos has a beneficial long position in the shares of O either through stock ownership, options, or other derivatives. This report has been generated by our stock research platform, Yiazou IQ, and is for educational purposes only. It does not constitute financial advice or recommendations.
