Qualcomm Stock: Investment In Market and IP Strength
Qualcomm (QCOM) develops and licenses wireless technology and designs chips for smartphones. The company’s key patents revolve around CDMA and OFDMA technologies, which are standards in wireless communications that are the backbone of all 3G, 4G, and 5G networks. Qualcomm’s IP is licensed by virtually all wireless device makers. The firm is also the world’s largest wireless chip vendor, supplying nearly every premier handset maker with leading-edge processors. Qualcomm also sells RF-front end modules into smartphones, as well as chips into automotive and Internet of Things markets. QCOM stock is currently trading at ~$156. Explore more on QCOM stock forecast.

EPS Surges and Revenue Trends
In the latest quarter ending September 30, 2024, Qualcomm reported an EPS without NRI (excluding non-recurring items) of $2.69, a substantial increase from $1.91 in the previous quarter and $2.02 in the same quarter last year. This marks a significant improvement in profitability, showcasing a robust quarter-over-quarter (QoQ) and year-over-year (YoY) growth. The company’s revenue per share also rose to $9.065 from $8.283 QoQ and $7.665 YoY, indicating strong top-line growth. Over the past five years, QCOM has sustained an annual EPS growth rate of 24.60%, while its 10-year CAGR stands at 10.90%, reflecting consistent long-term performance.
Qualcomm’s gross margin for the quarter was 56.22%, slightly below its 5-year median of 57.51% and significantly below its 10- year high of 64.57%, suggesting some margin pressure. However, its share buyback activities have helped enhance earnings per share by reducing the number of shares outstanding. Over the past year, the buyback ratio was 0.10%, indicating that 0.10% of shares were repurchased, while the 5-year buyback ratio stands at 0.50%. These buybacks have a favorable impact on EPS by increasing the value of remaining shares. Industry forecasts predict a growth rate of approximately 7% annually over the next decade, suggesting a positive outlook for the sector.
Looking forward, analyst estimates indicate that QCOM could achieve revenues of $42,382.17 million in 2025, growing to $46,116.92 million by 2027. The estimated EPS for the next fiscal year is $9.555, which may rise to $10.294 the following year. This positive outlook aligns with the industry growth forecast and underscores Qualcomm’s potential to capitalize on market opportunities. The next earnings release will be on January 31, 2025, when further insights into the company’s strategic initiatives and financial health will be provided.

ROIC, WACC, and Capital Allocation Insights
Qualcomm demonstrates strong financial performance and effective capital allocation, as evidenced by its Return on Invested Capital (ROIC) consistently exceeding its Weighted Average Cost of Capital (WACC). Over a five-year median, QCOM’s ROIC stands at 27.84%, while the WACC is 9.80%. This positive spread indicates that the company is generating economic value and efficiently using its capital.
More recently, the ROIC is at 28.03%, comfortably above the WACC of 11.84%. This further confirms that Qualcomm is successfully creating shareholder value by investing in projects that yield returns above their cost of capital. The substantial difference between ROIC and WACC suggests robust profitability and strategic management.
The company’s high Return on Equity (ROE) of 42.24% underscores its ability to generate profits from shareholders’ equity, with historical highs reinforcing its capacity for capital efficiency. Qualcomm’s financial metrics reflect a well-managed company that effectively drives growth and enhances economic value through prudent investment strategies.

Growth Metrics and Future Payout Prospects
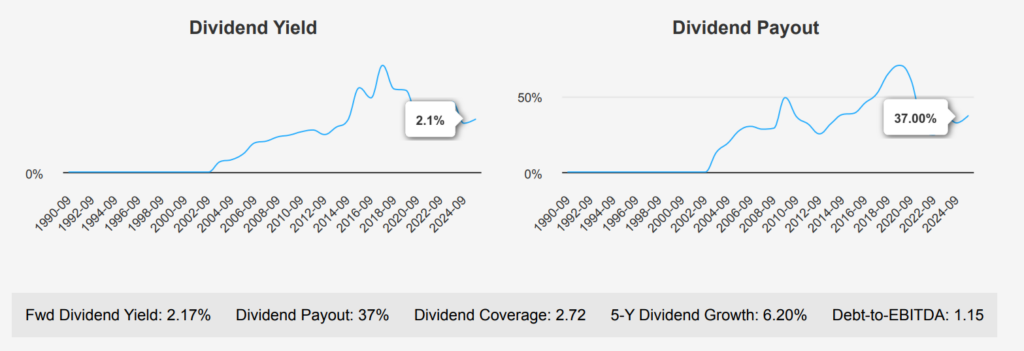
Qualcomm has demonstrated robust dividend growth, with a 3-year growth rate of 7.5% and a 5-year growth rate of 6.2%. In the most recent quarter, QCOM stock maintained its dividend at $0.85 per share, reflecting robust financial health and a commitment to returning value to shareholders. The forward dividend yield stands at 2.17%, slightly below its 10-year median of 2.77%, indicating potential undervaluation relative to historical yield trends.

The company’s dividend payout ratio is 37%, significantly lower than its historical highs, suggesting ample room for dividend increases. This is supported by a manageable debt-to-EBITDA ratio of 1.15, which indicates low financial risk and strong debt servicing capacity.
Compared to its sector, QCOM’s dividend yield is competitive, although slightly below its historical medians. The future 3-5 year dividend growth rate may stay at 4.53%, suggesting a continued, albeit slower, growth trajectory. The next ex-dividend date is on March 5, 2025, given the quarterly dividend frequency and ensuring it does not fall on a weekend. This outlook, combined with its solid financials, positions Qualcomm favorably for sustained dividend growth.

Current Market Pricing vs. Intrinsic Value
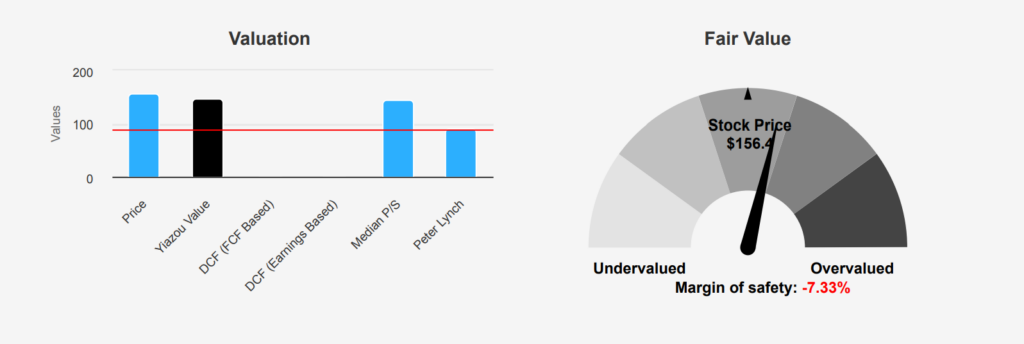
Qualcomm stock is currently trading at $156.4, which is above its intrinsic value of $145.71, reflecting a negative margin of safety of -7.34%. This suggests that the stock might be overvalued at the current market price, as the intrinsic value does not provide a buffer against price volatility. The Forward P/E ratio of 13.96 shows a more favorable valuation than its TTM P/E of 17.4, indicating potential earnings growth. Historically, QCOM’s P/E has fluctuated between a high of 49.87 and a low of 9.38 over the past decade, with a median of 18.78, placing the current TTM P/E slightly below the median.
Examining other valuation metrics, the TTM EV/EBITDA stands at 13.74, slightly above its 10-year median of 12.31 but well below the high of 38.63. This suggests a moderate valuation relative to its historical averages. The Price-to-Book (P/B) ratio is currently 6.63, which is below its median of 7.23 over the past decade yet significantly lower than its historical high, indicating a potential undervaluation in terms of book value. The TTM Price-to-Free-Cash-Flow ratio of 15.84 is also below its median of 18.49, indicating a relatively attractive valuation in terms of cash flow.
The Price-to-Sales (P/S) ratio of 4.54 is higher than its 10-year median of 4.11, suggesting the market might be pricing in aggressive growth expectations. Analyst ratings and price targets for QCOM have been slightly decreasing, with a current price target of $206.35, down from $214.11 two months ago. Despite the slightly negative margin of safety, the stock’s fundamentals, combined with analyst optimism, suggest a cautiously optimistic QCOM stock forecast, provided investors are comfortable with the current valuation metrics and potential volatility.

Balancing Margins, Insider Activity, and Financial Health
Qualcomm stock is currently experiencing several risks that investors should be aware of. The company is facing potential sustainability issues with its tax payments, as it appears to be paying lower taxes which have inflated earnings. This situation might not last, potentially impacting future profitability. Qualcomm’s asset growth is at a rate of 16.6%, which outpaces its revenue growth of 13.3%, indicating potential inefficiencies in asset utilization. The declining gross and operating margins, with average annual declines of -2.7% and -3.9% respectively, suggest decreasing profitability and operational efficiency. Furthermore, the recent insider selling activity, with 40,224 shares sold and no insider buying, could signal a lack of confidence from insiders.
On the positive side, Qualcomm’s Piotroski F-Score of 8 indicates a strong financial health position, and the Beneish M-Score of -2.46 suggests a low likelihood of earnings manipulation. The company’s stock is trading near its one-year lows in both PB and PE ratios, presenting potential value opportunities for investors. Qualcomm’s Altman Z-score of 5.95 points to robust financial health, and its balance sheet strength is commendable. Despite the risks, these positive indicators may offer some reassurance to potential investors under the QCOM stock forecast.
QCOM Stock: Sell Trends and Institutional Confidence
In the past year, Qualcomm has seen a significant number of insider sales with no insider purchases, indicating a trend where company directors and management are reducing their stakes. Over the last 12 months, insiders have executed 36 sell transactions, with 16 occurring in the past six months and 10 in the past three months. This consistent selling activity suggests that insiders might be capitalizing on recent stock performance or anticipating future challenges, which could be viewed with caution by potential investors.
Insider ownership stands at a modest 0.17%, which is relatively low, suggesting that QCOM’s leadership may not have substantial personal financial stakes in the company’s long-term performance. On the other hand, institutional ownership is quite high at 78.68%, indicating strong institutional confidence and support. The high institutional ownership could offset some concerns regarding insider selling, as institutions typically conduct thorough research before maintaining significant positions. However, the persistent insider selling trend warrants careful monitoring for any potential implications on the QCOM stock forecast.

Dark Pools and Market Volumes For QCOM Stock
Qualcomm demonstrates a robust liquidity profile, as seen in its average daily trading volume of 8,056,597 shares over the past two months. This suggests a healthy level of investor interest and activity. However, the daily trading volume recently recorded at 6,315,453 shares indicates a slight decrease from its two-month average, potentially reflecting short-term fluctuations or changes in market sentiment.
The Dark Pool Index (DPI) for QCOM stands at 42.74%, which implies that a significant portion of the company’s trades occurs in dark pools— private exchanges where trades are executed away from the public eye. A DPI of 42.74% suggests that nearly half of QCOM’s trades might not affect the stock’s market price immediately, potentially leading to less visible price impact and possibly reduced volatility.
Overall, QCOM’s trading and liquidity conditions appear stable, with strong average trading volumes supporting ease of entry and exit for investors. The notable DPI percentage might indicate that institutional investors are actively trading QCOM, which could have implications for its price movements. Investors should monitor these trading volumes and DPI trends to understand better market dynamics, QCOM stock forecast, and potential liquidity risks.
Recent Bipartisan Activity in QCOM Stock
In recent congressional trades, two notable transactions involve the purchase of Qualcomm shares. On November 20, 2024, Marjorie Taylor Greene, a Republican member of the House of Representatives, purchased shares valued between $1,001 and $15,000. This transaction was reported on November 21, 2024. Similarly, William R. Keating, a Democratic representative, made a purchase of QCOM shares within the same value range on October 31, 2024, which was reported on November 6, 2024.
Both transactions reflect an interest in Qualcomm, potentially suggesting confidence in the company’s future performance, perhaps due to technological advancements or strategic developments. Observing trades from representatives of both major parties could indicate a broader, cross-party expectation of positive returns from such investments, or it could simply be a coincidental personal financial strategy. However, these trades underscore the importance of monitoring congressional trading activities for insights into QCOM stock forecast.
Disclosures:
Yiannis Zourmpanos has a beneficial long position in the shares of QCOM either through stock ownership, options, or other derivatives. This report has been generated by our stock research platform, Yiazou IQ, and is for educational purposes only. It does not constitute financial advice or recommendations.


