


Nebius Stock: Invest in AI Infrastructure
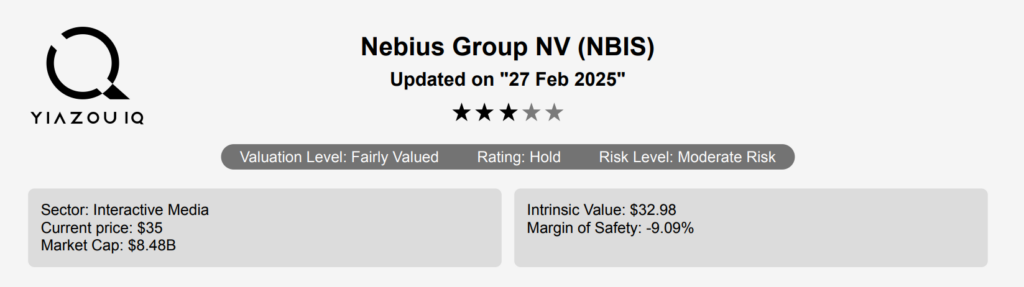
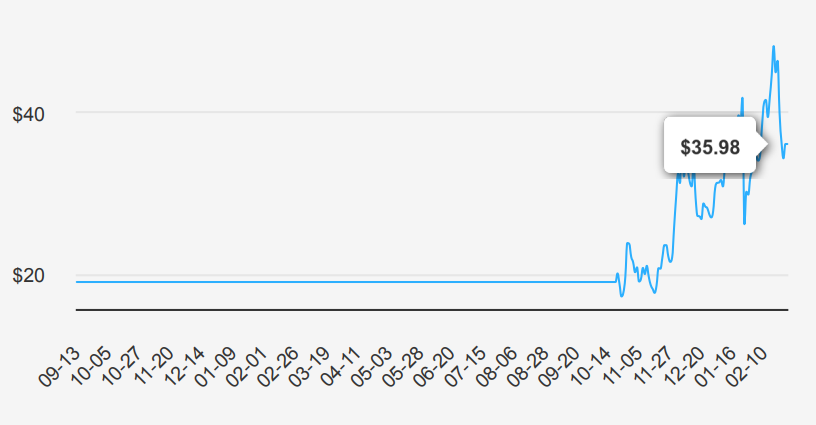
Nebius Group NV is a tech company. It is a European provider of infrastructure and services to AI builders globally. The group builds full-stack infrastructure to service the growth of the AI industry, including the scale of GPU clusters, cloud platforms, tools, and services for developers. It has R&D hubs across Europe, North America and Israel. Nebius stock is currently trading near $36.
EPS Decline, Buybacks, and Long-Term Growth Outlook
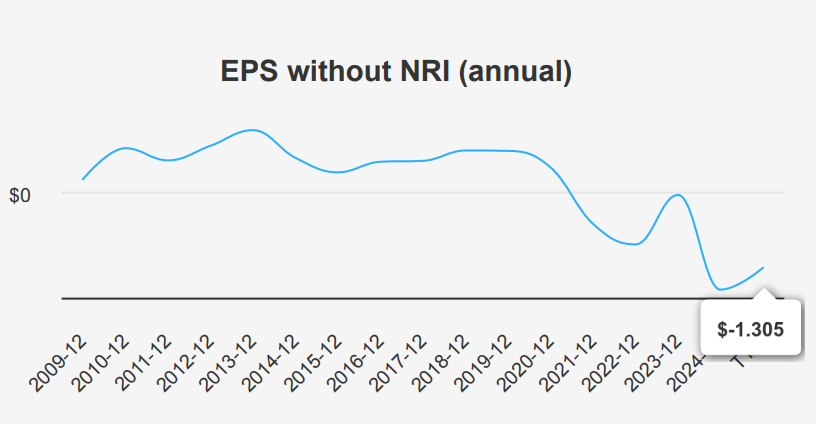
NBIS reported a challenging quarter, with EPS without NRI (excludes non-recurring items) at -$0.579, a decline from -$0.26 in the previous quarter and -$0.193 in the same quarter last year. This significant drop reflects ongoing pressures in the business environment. Meanwhile, the company’s revenue per share came in at $0.161, down from $0.217 in the prior quarter. Over the past five and ten years, EPS without NRI has not shown growth, indicating that NBIS has struggled to maintain or improve its profitability over these periods. The company’s gross margin stands at 37.60%, which is the lowest in the past decade, underscoring difficulties in maintaining cost efficiencies.
In terms of capital returns, NBIS has engaged in share buybacks, with the 1-year buyback ratio at 44.90%, meaning 44.9% of the previous shares were repurchased, a stark contrast to negative ratios in prior years. This aggressive buyback approach has likely offset some of the EPS dilution from poor earnings performance. However, it raises questions about the sustainability of such a strategy given the ongoing losses. The industry growth forecast for the next ten years is modest, with an expected growth rate of around 3% annually, which may not provide significant tailwinds for NBIS.
Looking ahead, analysts estimate a revenue of approximately $686.8 million for the upcoming fiscal year, with an EPS forecast of -$1.080 for FY1, indicating continued challenges. The next earnings release is expected on April 25, 2025, which will provide further insights into whether strategic adjustments are yielding improvements.
ROIC at -12.11%—A Sign of Value Destruction
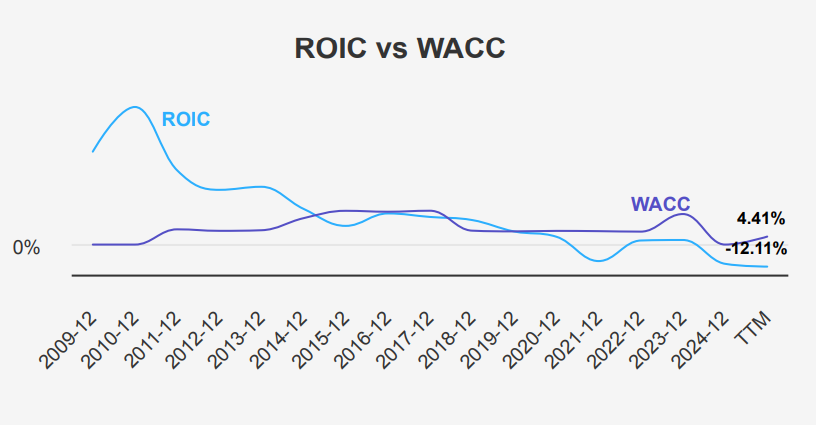
NBIS’s recent financial performance indicates a challenging situation in terms of capital efficiency and value creation. Over the past five years, the company’s median Return on Invested Capital (ROIC) was 2.52%, which is significantly lower than its median Weighted Average Cost of Capital (WACC) of 7.38%. This suggests that NBIS has been destroying value rather than creating it, as the cost of capital exceeds the returns generated on investments.
Currently, the situation appears more severe with a current ROIC of -12.11%, while the WACC stands at 4.41%. This negative ROIC further emphasizes the inefficiency in capital allocation and indicates that the company is not generating enough return to cover its cost of capital, leading to value destruction.
Additionally, the negative Return on Equity (ROE) of -5.76% points to poor management of shareholder equity. Overall, NBIS needs to improve its operational efficiencies, perhaps by reassessing its investment strategies and cost management, to enhance its financial performance and start generating economic value.
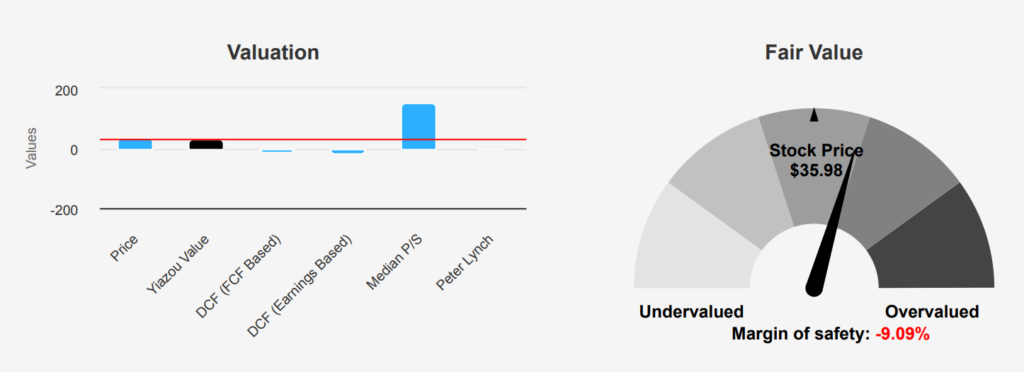
Trading 9.1% Above Intrinsic Value—NBIS Stock Overpriced?
Nebius stock is currently trading at $35.98, above its intrinsic value of $32.98, indicating a negative margin of safety of -9.1%. This suggests the stock may be overvalued as its market price exceeds the calculated intrinsic value. The TTM P/S ratio stands at 66.32, which is significantly higher than its 10-year median of 5.82, signaling potential overvaluation relative to historical trends. The TTM EV/EBITDA ratio is notably negative at -17.44, which is at the low end of its 10-year range and suggests operational challenges or accounting anomalies.
Historically, the P/E has reached a high of 270.57, but the current loss position marks a deviation from its 10-year median of 46.34. Additionally, the TTM Price-to-Book ratio is 2.6, below its 10-year median of 4.47, which could suggest the stock is undervalued relative to its book value, barring the broader negative indicators.
With no current analyst ratings or price targets available, the outlook for NBIS remains uncertain and potentially bearish. The absence of positive cash flow, as indicated by a TTM Price-to-Free-Cash-Flow of 0.0, coupled with the current valuation metrics, suggests caution. Investors should weigh these factors against sector norms and company-specific risks when considering NBIS as a potential investment.
High Debt, Declining Margins, and Potential Financial Manipulation
Nebius’s financial health presents a mixed picture. A significant concern is the persistent issuance of new debt, totaling $972.326 million over the past three years, which could strain financial flexibility. Additionally, the company has incurred losses in 67% of the past 12 quarters, indicating operational challenges. The declining gross margin, at an annual average rate of -5.9%, suggests worsening cost management or competitive pressures. Moreover, the high Beneish M-Score of 3.46 could imply potential financial statement manipulation, raising questions about the reliability of reported figures.
Conversely, Nebius exhibits several strengths. The Piotroski F-Score of 7 indicates robust financial health, reflecting efficient asset utilization and profitability. The company also benefits from predictable revenue and earnings growth, which can provide stability and investor confidence. Its strong Altman Z-score of 43.06 further underscores financial stability, suggesting a low risk of bankruptcy. The solid balance sheet ranking supports the notion of a resilient financial foundation, potentially offsetting some operational and debt concerns. However, investors should remain cautious, considering both the positive indicators and the significant risks associated with the company’s financial practices and performance trends.
Nebius Stock Zero Insider Ownership—A Red Flag for Investors?
The insider trading analysis for Nebius stock over the past 12 months indicates a complete absence of trading activity by company insiders, as there have been zero insider buys and sells recorded over the 3, 6, and 12-month periods. This suggests a lack of trading interest or financial engagement from the company’s directors and management in their own company stock. The insider ownership stands at 0%, indicating that no company insiders hold shares in the company, which could raise questions about the alignment of interests between management and shareholders.
On the other hand, institutional ownership is at 20.77%, showing that a modest portion of the company’s shares are held by institutional investors. This level of institutional ownership might suggest some level of confidence from these entities in the company’s potential, but it’s not particularly high. The absence of insider trading activity could mean that insiders do not expect significant changes in the company’s performance in the short term, or it may reflect other strategic considerations.
NBIS Stock Trading Volume Down—Investor Confidence Waning?
Nebius stock is currently experiencing a trading volume of 11,565,214 shares, which is slightly below its two-month average daily trading volume of 12,589,149 shares. This indicates a decrease in trading activity, suggesting potential investor hesitation or reduced market interest compared to recent months.
In terms of liquidity, the trading volume remains relatively robust, ensuring that investors can execute trades without significant price impact. However, the dip below the average might point to a temporary decrease in liquidity.
The Dark Pool Index (DPI) for NBIS is 42%, suggesting that a substantial portion of the trading volume is occurring in private exchanges. A DPI of 42% indicates a moderate level of off-exchange trading, which could be interpreted in different ways. It might suggest that institutional investors are actively participating in NBIS transactions, potentially influencing the stock’s price stability and trading dynamics.
Overall, while trading activity is slightly below average, liquidity remains sufficient for most investors. The notable DPI percentage highlights the importance of monitoring institutional trading patterns, as these can provide insights into broader market sentiment and future price movements for NBIS.
Disclosures:
Yiannis Zourmpanos has a beneficial long position in the shares of NBIS either through stock ownership, options, or other derivatives. This report has been generated by our stock research platform, Yiazou IQ, and is for educational purposes only. It does not constitute financial advice or recommendations.