Micron Stock: Core Revenue Streams and Market Integration
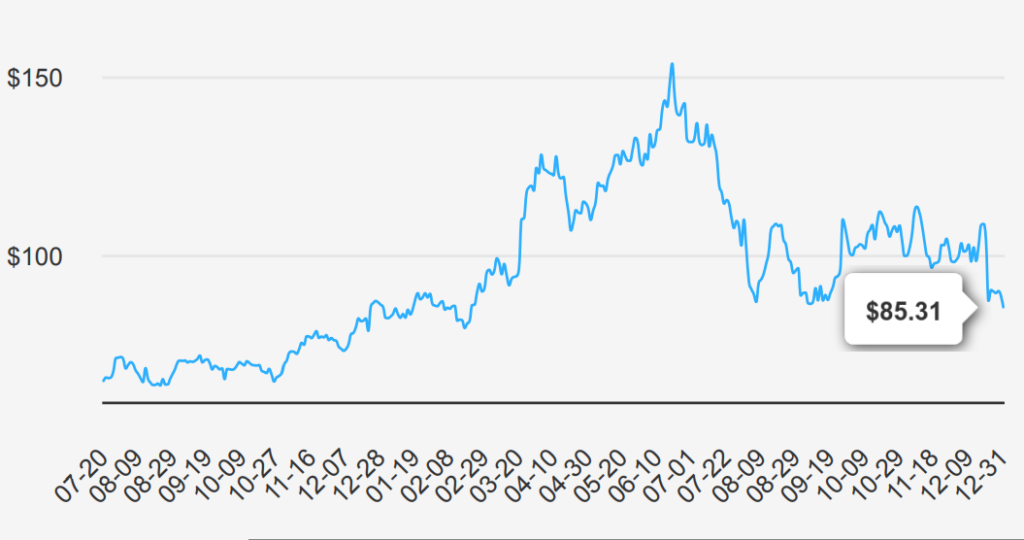
Micron (MU) is one of the largest semiconductor companies in the world, specializing in memory and storage chips. Its primary revenue stream comes from dynamic random access memory, or DRAM, and it also has minority exposure to not-and or NAND, flash chips. Micron serves a global customer base, selling chips into data centers, mobile phones, consumer electronics, and industrial and automotive applications. The firm is vertically integrated. MU stock is currently trading at ~$85.3. Lets explore Micron stock price forecast.

Quarterly EPS Trends and Long-term Growth Projections
In the latest quarter ending November 2024, Micron Technology reported an EPS without NRI (excluding non-recurring items) of $1.79, a significant improvement from $1.18 in the previous quarter and a turnaround from the negative $0.95 recorded in the same quarter last year. Revenue per share also showed a robust increase, reaching $7.762, up from $6.681 in the prior quarter and $4.296 a year ago.
Micron’s gross margin for the quarter stood at 30.92%, slightly above the five-year median of 30.57%, but below the ten-year median of 34.92%. Although the gross margin remains below its ten-year high of 58.87%, the improvement from past lows suggests effective cost management and operational efficiencies. The company’s share buyback ratio over the past year was -0.90%, indicating a reduction in shares outstanding, which can enhance EPS by distributing profits over fewer shares. This contrasts with the more aggressive buyback activity seen in the past decade, where the highest three-year buyback ratio reached 1.20%.
Looking ahead, analysts estimate Micron’s EPS will grow to $6.358 in the next fiscal year and $9.637 in the following one, supported by a projected industry growth rate of approximately 7% annually over the next decade. With the next earnings report scheduled for March 20, 2025, Micron is positioned for potential continued growth, driven by industry demand and strategic operational improvements.

ROIC vs. WACC and Capital Efficiency Challenges
Micron demonstrates a nuanced financial performance when analyzing its ROIC against its WACC. Over the past five years, MU has maintained a median ROIC of 7.29%, slightly below its WACC median of 9.17%. This indicates that, historically, the company has struggled to exceed its cost of capital, suggesting limited economic value creation during this period. In the most recent analysis, MU’s ROIC stands at 7.32%, while the WACC is at 12%, further underscoring a gap under Micron stock price forecast where the company is not covering its cost of capital, thus not generating positive economic value.
When looking at broader historical trends, MU’s ROIC and WACC have both fluctuated significantly, with ROIC reaching as high as 50.31% and as low as -11.09%, and WACC ranging from 7.97% to 12.1%. These fluctuations highlight the volatile nature of MU’s financial performance, possibly influenced by cyclical industry conditions or strategic investments. The median ROE of 7.18% over five years further supports the narrative of underwhelming return generation relative to the cost of equity, but with a notable 10-year high of 55.52%, it underscores potential volatility and occasional strong performance periods. Overall, MU’s financial efficiency indicates room for improvement in consistently generating economic value.

Stable Payouts and Modest Growth Outlook
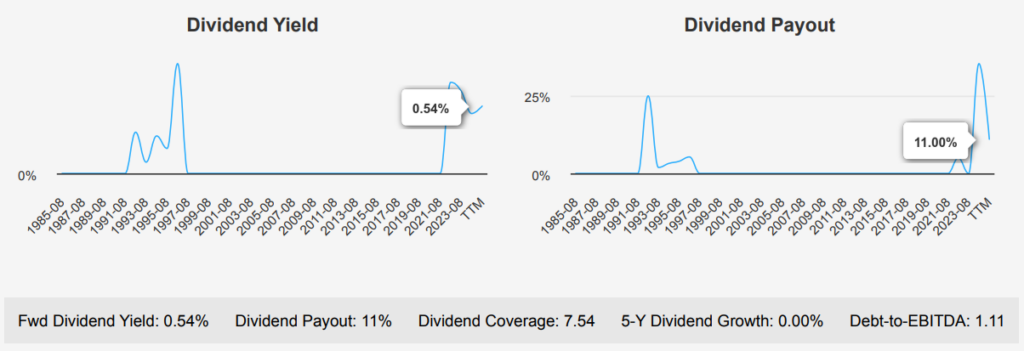
Micron Technology (MU) has shown consistent dividend payouts of $0.115 per share over recent quarters, maintaining a stable dividend yield of around 0.53%, which aligns closely with its 10- year median yield of 0.52%. Notably, the dividend growth rate over the past 5 years and 3 years has been flat. This stagnation in growth may be from the company’s strategic financial management decisions, focusing more on reinvestment rather than increasing dividend payouts.

Under Micron stock price forecast, the forward-looking estimate of a 3.78% dividend growth rate over the next 3-5 years suggests potential for modest improvement, possibly driven by anticipated earnings growth or strategic shifts in capital allocation. Financially, Micron exhibits a strong position with a Debt-to-EBITDA ratio of 1.11, indicating low financial risk and robust debt-servicing capability, which is favorable against industry norms. This strength provides a solid foundation for potential future dividend increases.
The next ex-dividend date is on April 4, 2024, ensuring shareholders have time to position themselves accordingly. Given this date, the consistency in dividend payouts, and the company’s financial health, Micron remains a stable option for income-focused investors within the semiconductor sector.

MU Stock Intrinsic Value Analysis and Market Metrics
Micron presents a compelling valuation case, with an intrinsic value of $97.66, slightly above its current market price of $85.3, suggesting a margin of safety of 12.65%. This indicates that MU holds undervaluation relative to its intrinsic worth. The Forward P/E ratio of 12.35 is favorable against the 10-year median of 10.15, indicating expectations of earnings growth. However, the TTM P/E ratio at 24.59 is relatively high, suggesting the market anticipates future growth.
In terms of EV/EBITDA and P/B ratios, MU presents a mixed picture. The TTM EV/EBITDA ratio stands at 7.84, which is above the 10-year median but significantly lower than the high of 69.36, indicating potential overvaluation within recent trends though not excessively so. The TTM P/B ratio is 2.03, above the 10-year median of 1.72, suggesting the stock holds higher value relative to its book value than it has been historically. However, both metrics remain within reasonable ranges that do not indicate extreme valuation discrepancies under Micron stock price forecast.
Analysts remain optimistic, with a recent price target of $130.24, although this has been adjusted downward from previous months. This optimism may reflect confidence in the company’s strategic direction or sector performance. Overall, while certain metrics suggest MU holds slight overvaluation relative to historical norms, the intrinsic value and analyst outlook provide a positive view, supporting the argument for potential long-term value.

Insider Sentiment and Financial Health Metrics
The recent insider transactions reveal a cautious outlook for Micron, with two selling transactions totaling 14,890 shares and no buying activity. This could be interpreted as a lack of confidence from those within the company. Furthermore, the company’s declining revenue per share over the past three years indicates potential challenges in maintaining growth or market share. A critical financial metric, the return on invested capital (ROIC), falling short of the weighted average cost of capital (WACC), suggests inefficiencies in capital utilization, which may hinder profitability and shareholder returns.
On the positive side, Micron’s financial metrics indicate a solid foundation. The Beneish M-Score of -2.56 suggests the company is unlikely to be manipulating its financial statements, which is a positive sign for investors concerned about transparency. The price-to-book (PB) ratio of 2.14 and price-to-sales (PS) ratio of 3.49 are close to their 1-year lows, suggesting potential undervaluation. Additionally, the Altman Z-score of 4.17 reflects strong financial health, reducing the risk of bankruptcy in the near term. Overall, while there are concerns about revenue and capital efficiency, Micron’s strong balance sheet and valuation metrics offer some reassurance under Micron stock price forecast.
Micron Stock: Selling Trends vs. Institutional Ownership
Analyzing the insider trading trends for Micron Technology (MU) reveals a consistent pattern of selling activity among company insiders over the past year. Over the last 12 months, there have been 39 instances of insider selling and no instances of insider buying. This trend is consistent over shorter periods as well, with 4 insider sales in the past 6 months and 2 in the past 3 months, with no insider purchases during these times.
The absence of insider buying activity could suggest a lack of confidence from insiders in the short-term stock performance. However, the high level of institutional ownership at 83.87% indicates strong institutional confidence in the company, which might counterbalance insider skepticism. Insider ownership stands at a modest 1.48%, reflecting limited insider influence on stock movements.
Overall, while insider selling is prevalent, the significant institutional ownership suggests that professional investors still see value in the company, possibly indicating a more complex outlook beyond insider moves alone.

Trading Volume Trends and Market Transparency Issues In MU Stock
Micron has shown strong liquidity and trading dynamics. The company’s daily trading volume stands at 21,360,910 shares, closely aligning with its two-month average daily trade volume of 21,901,492 shares. This consistency in trading volume suggests stable investor interest and active trading participation, facilitating ease of entering and exiting positions.
Moreover, the Dark Pool Index (DPI) for MU is at 36.72%. This figure indicates that a significant portion of the trading activity, over a third, occurs in dark pools. While this can imply that there is significant institutional interest, it may also suggest that large trades are through traditional exchanges to minimize market impact.
Overall, MU’s liquidity profile is robust, with trading volumes supporting active market engagement. However, the high DPI percentage points to substantial off-exchange trading, which investors should consider when evaluating market transparency and potential price discovery limitations. This combination of metrics provides a nuanced view of MU’s trading environment, balancing liquidity with the implications of dark pool activity.
Political Transactions and Potential Impacts
Two significant trades involving the stock ticker MU by members of the U.S. House of Representatives in 2024. On September 6, Representative John James, a Republican, reported a sale transaction of MU shares valued between $1,001 and $15,000, which occurred on September 4. This transaction was reported shortly thereafter on September 9, indicating a relatively quick disclosure. Earlier in the year, Representative Kathy Manning, a Democrat, also reported a sale of MU shares within the same value range on February 6, with the transaction taking place on January 23 and reported on February 7.
Both trades involve the sale of MU stock, suggesting a potential bipartisan inclination towards divesting from this particular equity during 2024. The disclosures reflect compliance with financial transparency requirements, although the reasons behind these sales are not disclosed. Such trades might indicate individual strategic financial decisions or reactions to broader market conditions affecting MU during the year.
Disclosures:
On the date of publication, Yiannis Zourmpanos did not hold (either directly or indirectly) any positions in the securities mentioned in this article. This report has been generated by our stock research platform, Yiazou IQ, and is for educational purposes only. It does not constitute financial advice or recommendations.


