


Verizon Stock Represents A Leader In the US Wireless Market
Wireless services account for about 70% of Verizon’s (VZ) total service revenue and nearly all of its operating income. The firm serves about 93 million postpaid and 21 million prepaid phone customers (following the acquisition of Tracfone) via its nationwide network, making it the largest US wireless carrier. Fixed-line telecom operations include local networks in the Northeast, which reach about 29 million homes and businesses and serve about 8 million broadband customers. Verizon also provides telecom services nationwide to enterprise customers, often using a mixture of its own and other carriers’ networks. Here is a fundamental exploration of the very basic question: Is Verizon stock a buy? VZ is currently trading at ~$45.
Verizon’s Earnings: Stability Amidst Growth Challenges
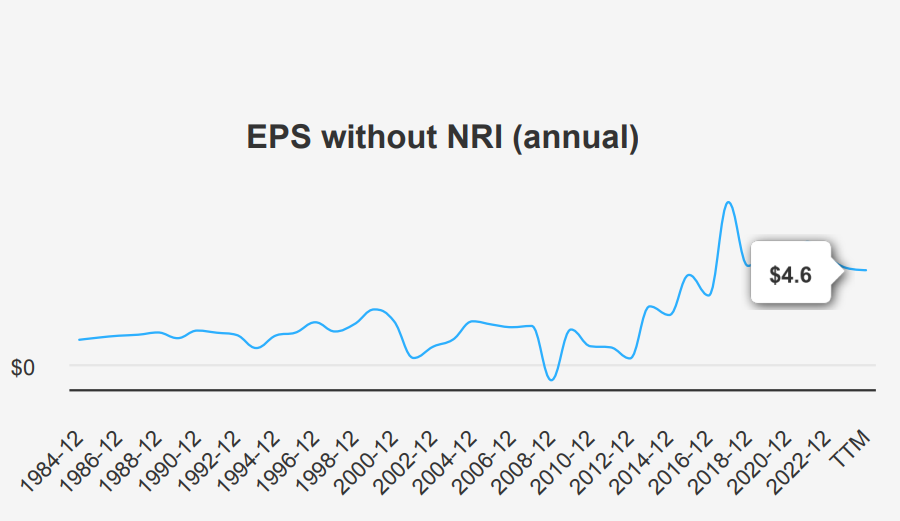
Verizon reported an EPS without nonrecurring items (NRI) of $1.15 for the second quarter of 2024, matching the previous quarter and slightly above the $1.08 recorded in Q4 2023. This stability in EPS without NRI, which excludes one-time items to reflect regular operations, contrasts with a minor decrease from $1.21 in Q2 2023. The company’s diluted EPS remained at $1.09, consistent with Q1 2024, following a volatile Q4 2023, where it dipped to -$0.64. Revenue per share was $7.77, slightly declining from $7.82 in Q1 2024. Over the past five years, VZ has achieved a modest annual EPS growth rate of 0.30%, while the 10-year CAGR stands at a stronger 6.30%.
Verizon’s gross margin in the latest quarter was 59.80%, above the five-year median of 58.50% and close to the 10-year high of 60.71%, indicating solid cost management and operational efficiency. The company’s share buyback activity has been minimal, with a 10-year buyback ratio of -1.90%, meaning it has slightly increased its share count over this period. This lack of significant buybacks has not contributed to EPS enhancement via share reduction, which some firms use to boost earnings per share by reducing the number of shares outstanding.
Looking forward, analysts estimate VZ’s EPS to reach $4.418 for the fiscal year ending 2025 and $4.616 for the following year, suggesting a positive earnings growth outlook. Industry growth forecasts predict a steady increase over the next decade, though specific percentage figures weren’t cited. Verizon’s next earnings call is scheduled for October 22, 2024, those who seek ‘Is Verizon stock a buy’ where investors will seek further insights into the company’s operational performance and strategic direction.
Verizon Stock: There is Value Creation
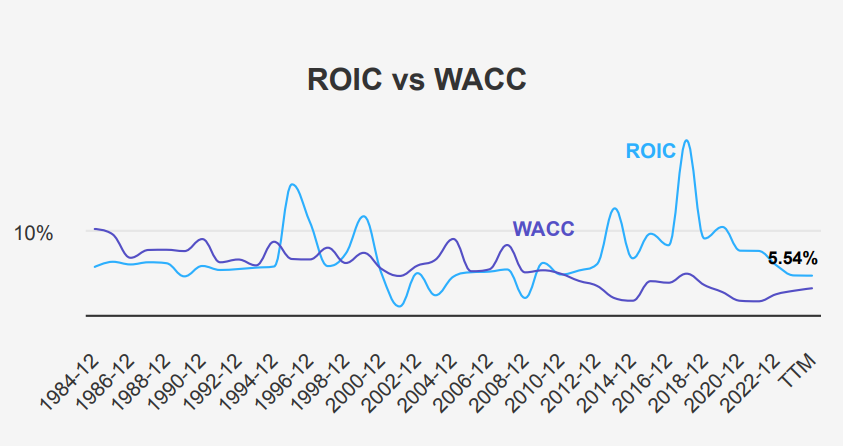
Verizon shows a positive economic value creation as its Return on Invested Capital (ROIC) consistently exceeds its Weighted Average Cost of Capital (WACC). Over the past five years, VZ’s median ROIC is 7.95%, significantly higher than the median WACC of 3.73%. This indicates that Verizon is effectively using its capital to generate returns that exceed the cost of the capital itself, thereby creating value for shareholders.
Currently, VZ’s ROIC stands at 5.54%, which, although at its 10-year low, still surpasses the current WACC of 4.35%. This suggests that VZ is still adding value even in its lower performance phase. The 10-year high ROIC of 18.72% further highlights exceptionally strong capital efficiency periods.
In terms of return on equity (ROE), VZ’s 5-year median of 27.55% and current ROE of 11.82% also demonstrate robust profitability, albeit at the lower end of its historical range. Overall, these metrics underscore Verizon’s effective capital allocation and sustained ability to generate positive economic value. This can be a fundamental reason to answer ‘Is Verizon stock a buy’.
Verizon’s Dividend: Steady Growth Amid Financial Challenges
In the most recent quarter, Verizon increased its dividend per share to $0.6775, reflecting a modest growth trend consistent with its 5-year and 3-year dividend growth rates of 2.00%. The company’s forward dividend yield stands at a competitive 6.04%, above the sector median of 4.61%, indicating a strong income potential for investors. However, the future 3-5-year dividend growth rate is estimated at a lower 1.79%, suggesting a potential slowdown.

Verizon’s current debt-to-EBITDA ratio is 4.25, above the moderate range and indicating a higher financial risk. This level suggests concerns about Verizon’s ability to service its debt, especially compared to industry norms efficiently.
The dividend payout ratio is 58%, which is significantly below its historical highs. This indicates a more sustainable approach in contrast to its previous 10-year median of over 100%. This conservative payout strategy may be a response to managing the high leverage.
Given the quarterly dividend frequency, the next ex-dividend date is projected to be 2025-01-09, a Thursday. Despite financial leverage concerns, this consistent dividend policy underscores Verizon’s commitment to returning value to shareholders.

Assessing Verizon’s Valuation: Insights and Implications
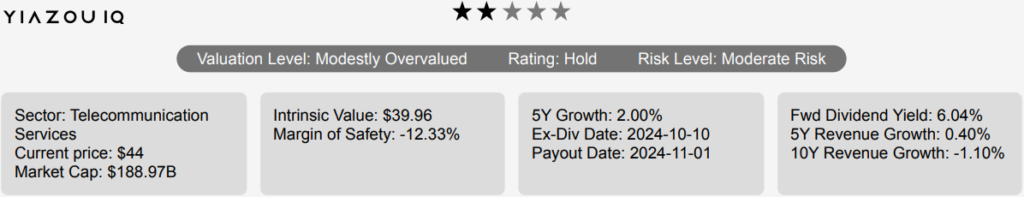
Verizon’s current intrinsic value is $39.96, while the stock trades at $44.89, indicating a negative margin of safety of -12.34%. This suggests the stock is currently overvalued relative to its intrinsic value, lacking a buffer to protect against downside risk. The Forward P/E ratio is 9.58, significantly lower than the TTM P/E ratio of 16.81 and below its 10-year median of 12.57, indicating potential undervaluation when considering future earnings. However, the TTM P/B ratio stands at 1.96, relatively close to its 10-year low of 1.32, yet well below the 10-year median of 4.07, suggesting that the stock might be fairly valued based on its book value.
The TTM EV/EBITDA ratio is currently 8.83, higher than the 10-year median of 7.99 but below the high of 9.17. This indicates that the stock is slightly more expensive relative to its earnings before interest, taxes, depreciation, and amortization than its historical average, although not excessively so. The price-to-free-cash-flow ratio is 13.59, lower than the 10-year median of 14.63, suggesting an attractive valuation in terms of cash generation relative to the stock price.
Analyst ratings provide a slightly positive outlook, with a price target of $46.42, a slight increase from previous targets. This indicates a moderate expectation of price appreciation, though not significantly higher than the current market price. Overall, Verizon’s valuation metrics suggest it is a stock that stands on overvaluation based on intrinsic value calculations but offers some attractive points when considering cash flow and future earnings potential. Investors should weigh these factors carefully against broader market conditions and investment strategies.

Verizon’s Financial Landscape: Navigating Risks and Rewards
Verizon faces significant risks, particularly due to its financial health indicators. The company’s long-term debt issuance of $979 million over the past three years signals a potential dependency on debt financing, which, coupled with the Altman Z-score of 1.2, puts it in the distress zone. This suggests a heightened risk of bankruptcy within the next two years. Additionally, the stock price and price-to-sales ratio at or near two-year highs might indicate overvaluation risk, especially as revenue growth has slowed over the past year. The declining dividend yield, which is near a two-year low, could also deter income-focused investors.
On the positive side, Verizon shows resilience in operational efficiency, with an expanding operating margin. This indicates that the company manages its core business well despite external pressures. Furthermore, the Beneish M-Score of -2.63 suggests that Verizon is unlikely to be manipulating its financial statements, providing some reassurance about the integrity of its financial reporting. Investors should weigh these factors carefully, balancing the risks of financial distress and potential overvaluation against the company’s operational strengths and financial transparency.
VZ Stock Insider Trading: Confidence or Caution
The insider trading activity for Verizon over the past year indicates a lack of buying interest among insiders, with no purchases recorded in the last 3, 6, or 12 months. However, there were four insider sales within the past year. This suggests a potential lack of confidence or a need for liquidity among executives or directors, but the absence of buying is more telling in terms of sentiment.
Insider ownership remains relatively low at 0.06%, indicating that company leaders do not hold significant personal stakes, which might dilute the alignment of their interests with those of regular shareholders. On the other hand, institutional ownership is quite substantial at 62.94%, reflecting a strong presence of large investors who could exert significant influence on corporate governance and strategic direction.
The lack of insider buying combined with moderate selling activity suggests a cautious or neutral outlook from those within the company, while the high institutional ownership points to continued confidence from the broader investment community.

Verizon’s Liquidity: Key Metrics for Smart Investors
Verizon displays moderate liquidity and trading activity. The average daily trading volume for the past two months is 18,727,323 shares, indicating a fairly active trading environment. Recently, the daily trading volume has slightly decreased to 15,610,246 shares, suggesting a potential softening in investor activity or interest.
The Dark Pool Index (DPI) for VZ is 42.61%, which reveals the proportion of trades executed through dark pools compared to the total trading volume. A DPI of 42.61% suggests a significant portion of trading occurs away from public exchanges, which might influence market transparency and price discovery processes.
Overall, while VZ maintains a solid level of liquidity, the decrease in daily trade volume relative to its recent average, coupled with a substantial DPI, may indicate subtle shifts in market dynamics. Investors should consider these factors when assessing the stock’s liquidity profile and potential price volatility.
Verizon’s Government Contracts: Peaks and Predictions Explored
Verizon has shown a fluctuating pattern in government contracts from 2019 to 2024. The amount increased significantly from $842.66 million in 2019 to over $1.33 billion in 2020. However, it dropped to $544.80 million in 2021 before rising again to over $1.03 billion in 2022 and reaching a peak of $1.46 billion in 2023. In 2024, the amount is projected to decrease to $630.47 million, indicating potential volatility in contract acquisitions.
Verizon’s Stock Patent Growth
From 2011 to 2022, Verizon steadily increased its patent holdings, emphasizing its commitment to innovation and technological leadership. Starting with 1,300 patents in 2011, the company expanded its portfolio annually, reaching 2,100 patents by 2015. This growth trend continued, with Verizon accumulating 2,500 patents by 2018 and expanding to 3,200 patents by 2020. By 2022, Verizon’s patent holdings peaked at 3,500, reflecting its ongoing investment in research and development to sustain its competitive edge.
Congressional Trading: Gottheimer’s Verizon Moves
On June 21 and June 25, 2024, Representative Josh Gottheimer, a Democrat from the House of Representatives, conducted two significant sales of Verizon stock. Each transaction fell within the range of $1,001 to $15,000, suggesting a strategic divestment from this particular holding. The timing of these transactions, reported on July 9, 2024, could imply a response to market conditions or personal financial strategy. Multiple sales close together may indicate an effort to reduce exposure to Verizon, possibly due to anticipated market volatility or reassessment of portfolio priorities.
Disclosures:
Yiannis Zourmpanos has a beneficial long position in the shares of VZ either through stock ownership, options, or other derivatives. This report has been generated by our stock research platform, Yiazou IQ, and is for educational purposes only. It does not constitute financial advice or recommendations.