Broadcom: From Semiconductor Giant to Software Powerhouse
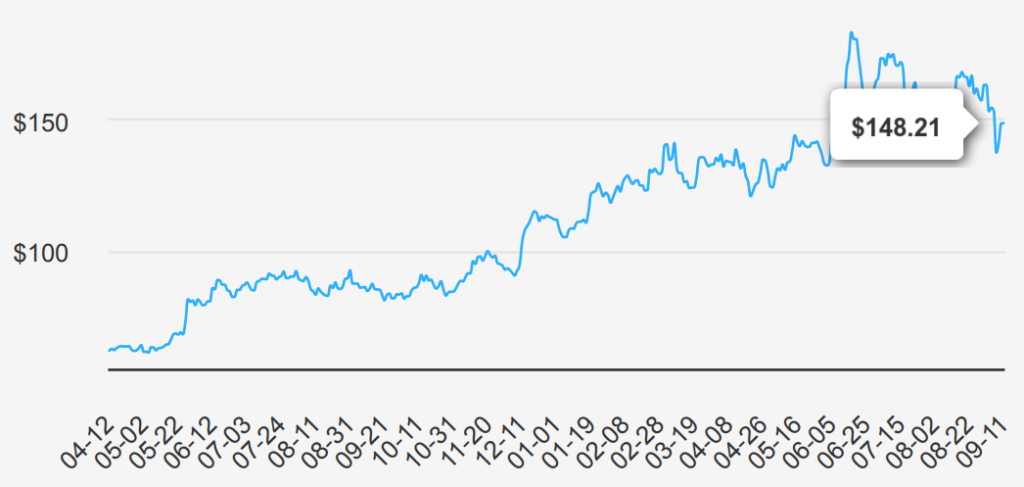
Broadcom stock represents the sixth-largest semiconductor company globally that has expanded into various software businesses, with over $35 billion in annual revenue. It sells 17 core semiconductor product lines across wireless, networking, broadband, storage, and industrial markets. It is primarily a fabless designer but holds some manufacturing in-house, such as its best-of-breed FBAR filters that sell into the Apple iPhone. In software, it sells virtualization, infrastructure, and security software to large enterprises, financial institutions, and governments. Broadcom is the product of consolidation. Its businesses are an amalgamation of former companies like legacy Broadcom and Avago Technologies in chips, as well as Brocade, CA Technologies, and Symantec in software. Broadcom stock is currently trading at ~148.

Broadcom Has Strong Earnings Growth
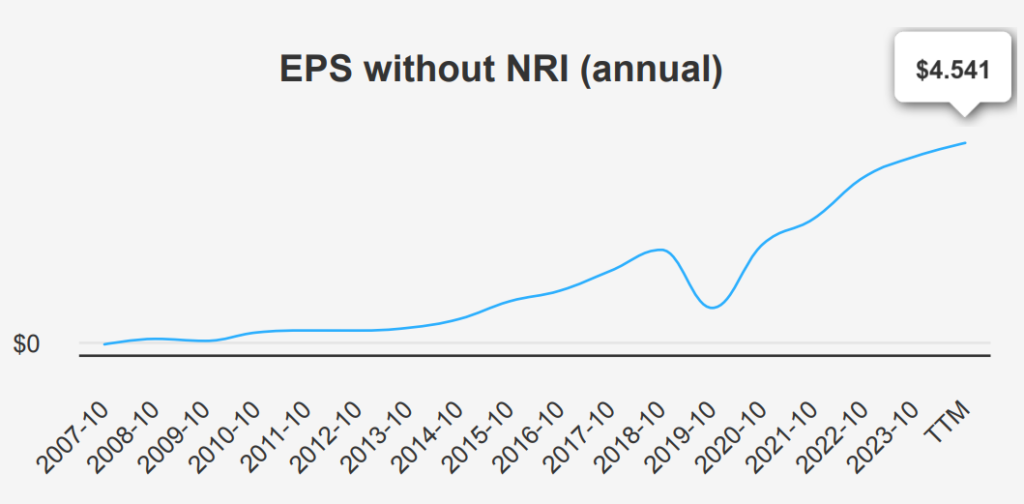
The company reported earnings for the quarter ending July 31, 2024, showcasing a robust performance. The EPS without non-recurring items (NRI) rose to $1.24, up from $1.096 in the previous quarter (QoQ) and $1.054 a year ago (YoY). Revenue per share also increased to $2.803 from $2.601 in the prior quarter. The company has demonstrated impressive long-term growth with a 5-year CAGR of 27.90% and a 10-year CAGR of 26.10% for annual EPS without NRI. Industry forecasts predict a significant growth trajectory of approximately 6% annually over the next decade.
Broadcom’s gross margin for the quarter was 63.90%, above its 5-year median of 61.36%. This margin showcases effective cost management and operational efficiency. Over the last decade, it has ranged between 43.97% and 68.93%. The company’s share buyback ratio over the past year is -12.70%. This indicates a reduction in outstanding shares, which can enhance EPS by spreading earnings over fewer shares. This ratio reflects a strategic repurchase of shares, increasing shareholder value and improving financial metrics.
Looking ahead, analysts estimate Broadcom’s EPS to reach $4.064 for the next fiscal year ending in October 2025. Revenue is projected to grow to $60,225.89 million by October 2025 and $67,726 million by October 2026. These forecasts suggest optimism around Broadcom’s continued expansion and market competitiveness. The next earnings release will provide further insights into AVGO’s performance and strategic direction, with a strong focus on sustaining its growth momentum.

Broadcom’s Past Success Vs Current Performance Trends
Over the past five years, Broadcom’s median ROIC was 13.03%, significantly higher than the median WACC of 6.94%. This indicates that the company has been successful in generating value historically, as its ROIC exceeded the cost of capital.
However, the ROIC stands at 6.29%, which is below the current WACC of 11.03%. This suggests that Broadcom is currently underperforming in value creation, as it is not covering its cost of capital. The recent decline in ROIC compared to historical highs of 34.58% might indicate potential inefficiencies or shifts in capital allocation strategies.

Broadcom Stock Offers Rising Dividends
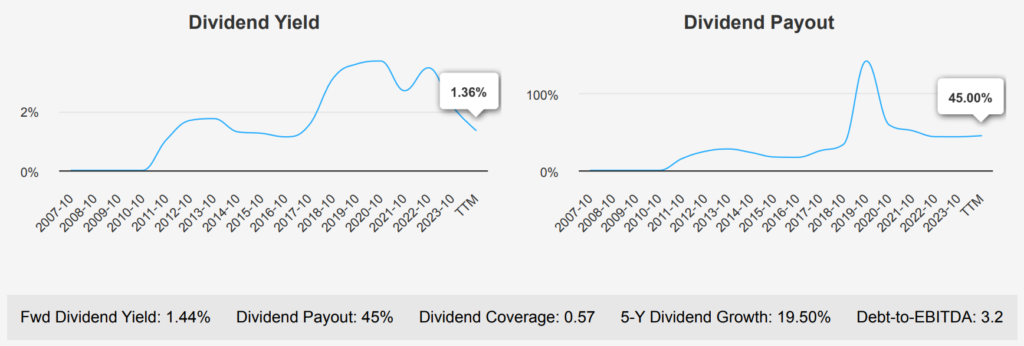
Broadcom has demonstrated consistent dividend growth, as evidenced by its 5-year dividend growth rate of 19.50% and a 3-year rate of 12.30%. The most recent quarterly dividend increased to $0.53 per share, up from $0.525, indicative of ongoing shareholder value enhancement. Broadcom’s forward dividend yield of 1.44% compared to the sector is relatively low, yet robust growth prospects balance this.

The company maintains a moderate debt-to-EBITDA ratio of 3.20, which suggests a cautious yet acceptable level of financial leverage and indicates manageable risk in terms of debt servicing, especially given the company’s cash flow capabilities. While the ratio is within a moderate range, it’s crucial for Broadcom to maintain this balance to avoid potential financial strain.
Looking ahead, Broadcom’s dividend growth rate is estimated to continue at a healthy 13.50% over the next 3 to 5 years. This reflects strong confidence in its future earnings potential. Based on the recent pattern, the next ex-dividend date is projected for September 19, 2024. Overall, Broadcom shows a solid track record of dividend growth, underpinned by its strategic financial management and market positioning.

Broadcom Stock: Current Overvaluation and Historical Context
Broadcom’s current market price of $148.21 significantly exceeds its intrinsic value of $95.91. This indicates a negative margin of safety of -54.53%. This suggests that the stock may be overvalued at current levels, lacking a buffer that typically safeguards investors against potential market corrections. The Forward P/E ratio of 24.62 is more in line with the historical median. However, the TTM P/E ratio is quite high at 128.68, compared to the 10-year median of 37.46. It is signaling potential overvaluation concerns when viewed through historical earnings lenses.
The TTM EV/EBITDA ratio is 32.69, higher than the 10-year median of 17.72, though below the decade high of 43.95. This indicates that while the company is trading at a premium compared to its long-term average, it is not at its historical peak. Similarly, the TTM P/B ratio is 10.5, above the median of 7.38 again. It suggests that the stock is priced richly compared to its book value. The TTM P/S ratio 14.23 also exceeds its historical median, indicating a premium valuation relative to sales.
Despite these valuation metrics suggesting overvaluation, analyst ratings remain optimistic, with a price target of around $195.15. Although this has seen fluctuations over recent months, this optimism may reflect confidence in Broadcom’s growth prospects or strategic initiatives.

Balancing Signals with Broadcom Stock’s Risk Metrics
Broadcom presents a mixed risk profile for potential investors. The recent insider selling activity, with 38,362 shares sold in four transactions over the past three months and no insider purchases, could indicate that insiders may not have confidence in the stock’s near-term valuation. Additionally, the company’s return on invested capital (ROIC) is less than its weighted average cost of capital (WACC). This suggests it might not utilize its capital efficiently, which could impact long-term profitability.
On the positive side, Broadcom’s financial health appears strong, with an Altman Z-score of 4.38, indicating a low risk of bankruptcy. The Beneish M-Score of -2.38 suggests the company is unlikely to be involved in financial manipulation. Furthermore, the company’s expanding operating margin and predictable revenue and earnings growth reflect operational efficiency and stable performance. These factors suggest that the company maintains robust financial health and growth prospects despite the potential inefficiencies in capital usage.
Insider Trends: Selling Spree at Broadcom
Insider trading activity for Broadcom over the past year indicates significant selling by insiders, with 23 sales and only 1 purchase. This trend has continued in the last six months with 14 sales and no purchases. Meanwhile, the past three months have seen 4 sales and still no purchases. This consistent pattern of selling could suggest that insiders believe the stock is either fully valued or are possibly reallocating their assets.
Insider ownership stands at a minimal 0.02%, indicating that insiders hold a negligible portion of the company’s shares. This low percentage suggests insiders might not have substantial personal financial stakes in the company’s stock performance. On the other hand, institutional ownership is high at 75.74%, which suggests confidence among large investors and funds.

Broadcom Stock Holds High Liquidity
Broadcom exhibits a robust liquidity profile, as evidenced by its recent trading volume metrics. The stock’s average daily trading volume over the past two months is 28,779,811 shares, indicating a highly active market presence. This substantial trading volume suggests Broadcom is a liquid asset, allowing for relatively easy entry and exit points for investors without causing significant price fluctuations.
Broadcom’s Dark Pool Index (DPI) is reported at 41.14%, which suggests that a significant portion of its trading occurs in non-public exchanges. A DPI of 41.14% indicates that nearly half of the shares traded may not be immediately visible on public exchanges, impacting the perceived supply and demand dynamics.
Broadcom Stock: Congress Trading
Two notable transactions involving Broadcom occurred in recent congressional trading activity. On September 4, 2024, Representative John James, a Republican from the House of Representatives, sold shares valued between $1,001 and $15,000. This transaction was reported on September 6, 2024, and is indicative of potential strategic repositioning in his portfolio.
Conversely, Senator Shelley Moore Capito, a Republican, purchased Broadcom shares within the same value range on August 27, 2024, and reported on September 5, 2024. This buy transaction suggests a differing outlook on Broadcom’s potential performance compared to Representative James’s sell action.


