


AT&T Stock: Powering Wireless, Internet, and Global Connectivity
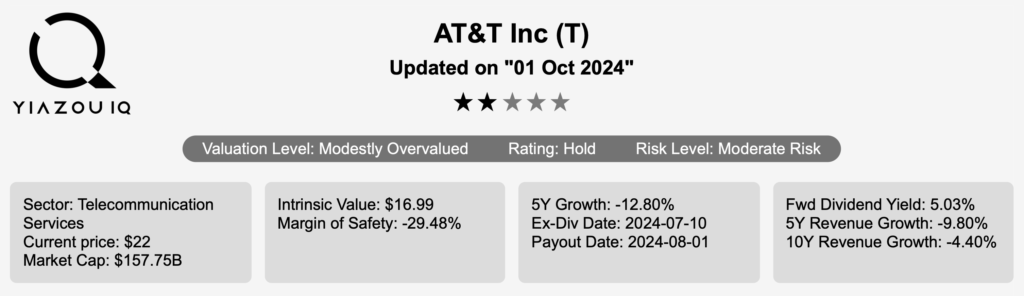
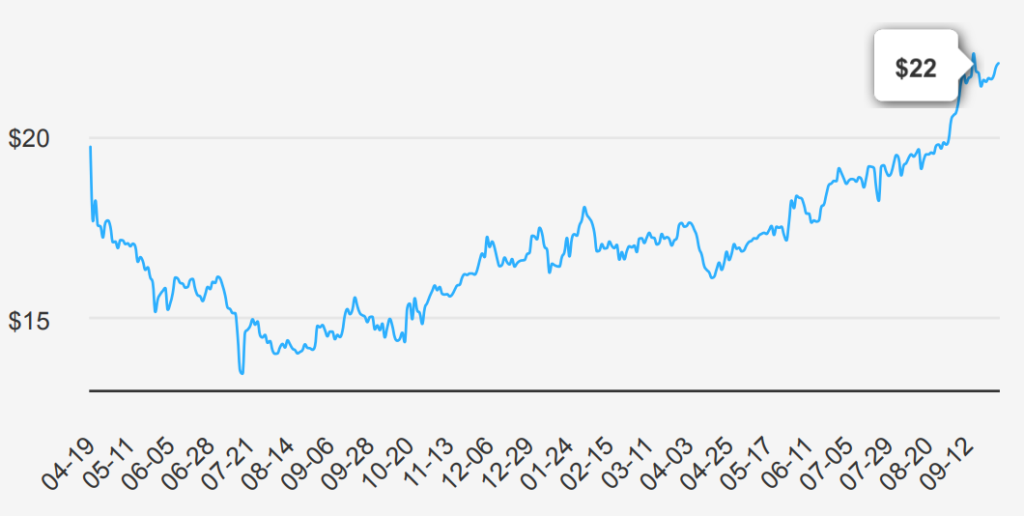
The wireless business contributes nearly 70% of AT&T’s (T) revenue. The firm is the third-largest US wireless carrier, connecting 72 million postpaid and 17 million prepaid phone customers. Fixedline enterprise services, which account for about 16% of revenue, include internet access, private networking, security, voice, and wholesale network capacity. Residential fixed-line services, about 11% of revenue, primarily consist of broadband internet access, serving 14 million customers. AT&T also has a sizable presence in Mexico, with 23 million customers, but this business only accounts for 4% of revenue. The firm still holds a 70% equity stake in satellite television provider DirecTV but does not consolidate this business in its financial statements. T stock is currently trading near $22. Let’s explore the key question here: Is AT&T Stock a Buy Now?
AT&T’s Earnings Climb, But Growth Remains Tepid
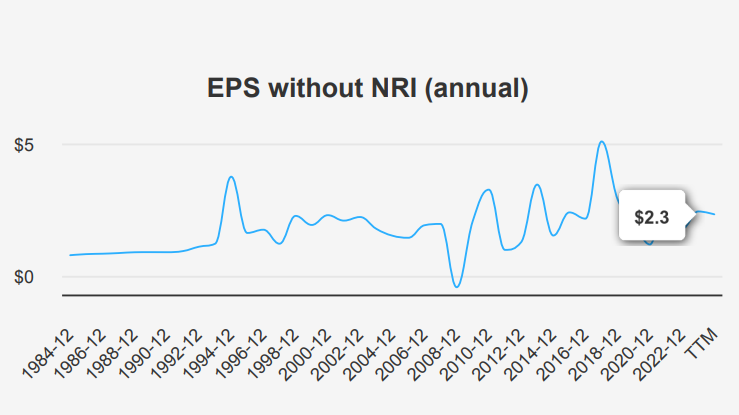
In the latest quarter ending June 30, 2024, T reported an EPS without NRI (excluding non-recurring items) of $0.57, showing a modest increase from the previous quarter’s $0.55 but a slight decline from the $0.63 recorded in the same quarter last year. The revenue per share was $4.14, a slight decrease from $4.175 in the previous quarter but close to the $4.167 from the same period last year. Over the past five years, the company’s annual EPS without NRI has had an average decrease rate of -1.00%, and over ten years, it has decreased by -2.20% annually.
The company’s gross margin reached 59.61%, its highest in the past decade, compared to a five-year median of 54.93%. Over the past ten years, the gross margin has ranged from a low of 51.53% to the current high. The share buyback ratio over the last year was -0.30%, indicating that the company has repurchased 0.30% fewer shares than it previously had outstanding. This move can positively influence EPS by reducing the number of shares outstanding, although the recent negative buyback ratios imply fewer share repurchases.
Looking ahead, analysts forecast revenue to reach $122,681.71 million by December 2024, with gradual increases in subsequent years. The estimated EPS for the next fiscal year ending is $2.021, increasing to $2.209 the following year. The telecommunications industry may grow at an average annual rate of 2.5% over the next decade, posing opportunities and challenges for T. The next earnings release is scheduled for October 23, 2024, providing further insights into the company’s financial trajectory and market conditions. This can be a positive base to address ‘Is AT&T Stock a Buy Now?’
T’s Marginal Gains: Stable but Improvement Needed
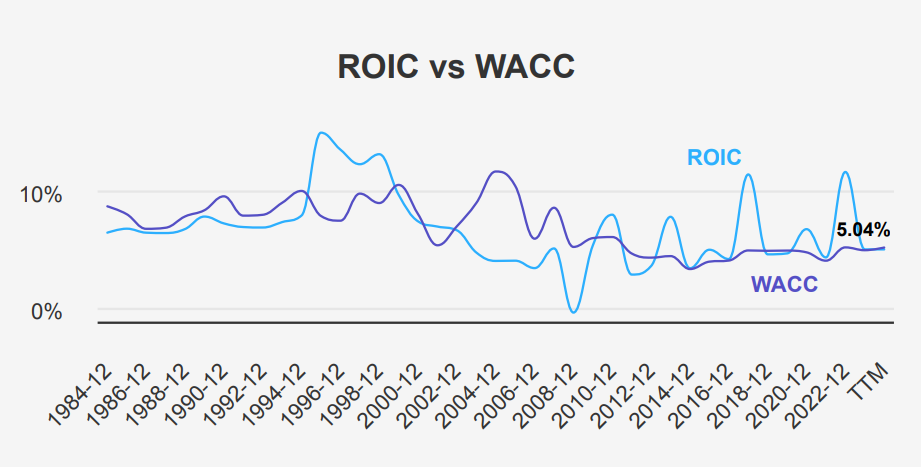
T’s financial performance, particularly regarding economic value creation, can be analyzed by comparing its Return on Invested Capital (ROIC) with its Weighted Average Cost of Capital (WACC). Over the past five years, T has maintained a median ROIC of 5.04%, which is slightly higher than its median WACC of 4.94%. This indicates that the company has been generating a small positive economic value, implying efficient capital allocation as it earns more on its investments than the cost of capital.
However, the current figures show a ROIC of 5.04% against a WACC of 5.23%, suggesting that, at present, the company is slightly underperforming relative to its cost of capital. This could imply a narrow margin where T is not adding significant shareholder value in the immediate term.
Historically, T’s ROIC has reached as high as 11.62%, which shows the potential for improved financial efficiency. The company should aim to enhance its capital allocation strategies to consistently exceed its WACC, thus ensuring sustainable value creation for shareholders.
AT&T’s Dividend: Stability Amidst Declines and Leverage Risks
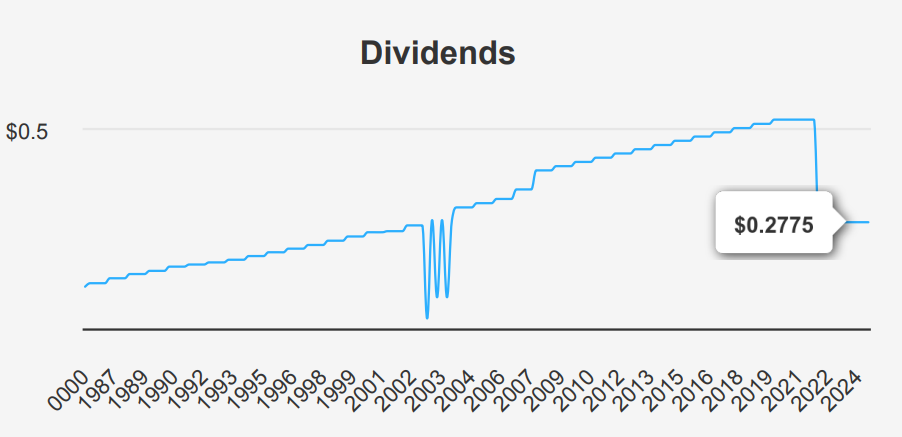
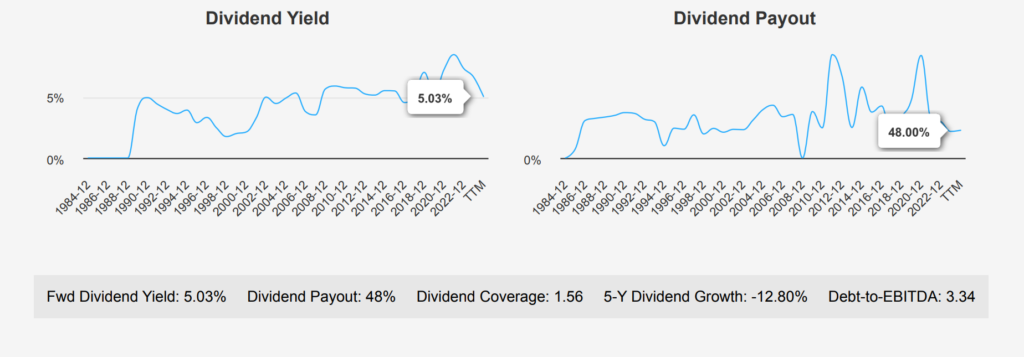
AT&T’s recent dividend data reveals a cautious outlook with stability in payouts but challenges in growth. The dividend per share for the most recent quarter remained consistent at $0.2775, reflecting a flat dividend growth trend. Over the past five years, the dividend growth rate has shown a decline of -12.80%, with a more pronounced drop of -18.90% over the last three years, indicating that the company has been adjusting its payout strategy.
The forward dividend yield stands at 5.03%, which aligns with the 10-year low, suggesting limited room for yield expansion. AT&T’s current dividend payout ratio is at 48.0%, significantly lower than its historical highs, providing some cushion for debt servicing and operational needs.
Comparatively, the Debt-to-EBITDA ratio is 3.34, placing it within a moderate risk category. This suggests that while the debt level is manageable, the company should be cautious with further leveraging.
The forward dividend growth rate is modestly estimated at 0.87%, reflecting conservative financial planning. Given the next ex-dividend date of October 10, 2024, the subsequent date is January 9, 2025, ensuring a consistent quarterly distribution schedule. This stable yet conservative dividend approach suggests a focus on maintaining financial health amid sectoral challenges.
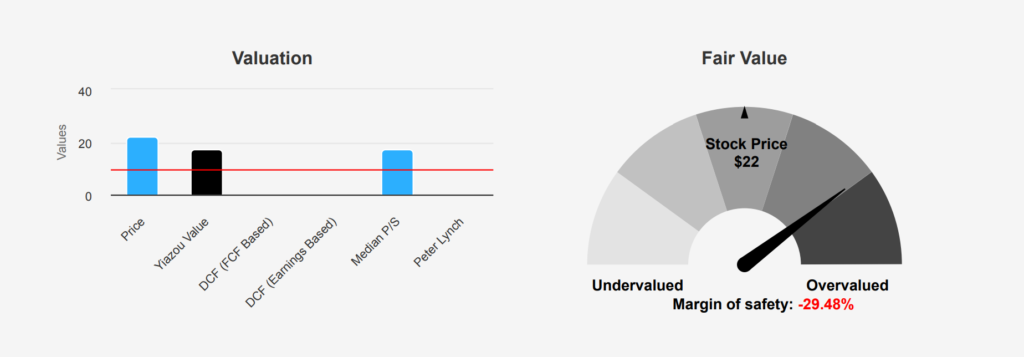
Valuation Signals T Stock’s Overvaluation Despite Optimism
The intrinsic value of T is currently at $16.99, while its market price stands at $22, indicating a negative margin of safety of -29.49%. This discrepancy suggests the stock is overvalued relative to its intrinsic worth. The current TTM P/E ratio is 12.64, slightly above the 10-year median of 11.97 but well below the 10-year high of 256.25, indicating potential overvaluation when compared to historical lows. The forward P/E of 9.67 suggests slightly better valuation prospects, though it’s still not offering a margin of safety. This is a negative point to address ‘Is AT&T Stock a Buy Now?’
Looking at the EV/EBITDA, the TTM figure is 6.81, close to the 10-year median of 6.46 and significantly lower than the 10-year high of 15.20. This suggests that T is not excessively overvalued in terms of enterprise value and is not trading at a significant discount. The TTM P/B ratio is 1.5, above the 10-year median of 1.14, but within the normal range, indicating the stock might have slight overvaluation based on book value metrics.
Analyst ratings suggest a cautious outlook, with a price target of $21.71, slightly below the current price, reflecting a conservative view on growth prospects. While the TTM P/S ratio of 1.29 is just under the 10-year high, it remains above the median, reinforcing the notion of limited upside without substantial growth catalysts. Overall, T appears to be trading above its intrinsic value with a limited margin of safety, suggesting investors should be cautious unless market conditions change significantly.
AT&T: Balancing Growth Challenges with Financial Strength Risks
AT&T presents a mixed risk profile with several warning signals that investors should consider. The Price-to-Book (PB) ratio of 1.49 is near a 10-year high. It indicates that the stock might be overvalued relative to its book value. Similarly, the Price-to-Sales (PS) ratio of 1.29 is also close to its upper historical range, suggesting potential overvaluation. The stock’s price nearing a 3-year high further supports this concern, particularly when juxtaposed with a declining revenue per share over the past five years. Additionally, the Altman Z-score of 0.81 places AT&T in the distress zone, highlighting a potential financial instability or bankruptcy risk within the next two years.
On the positive side, AT&T’s Piotroski F-Score of 8 suggests a robust financial condition, indicating strong profitability, leverage, and liquidity measures. The Beneish M-Score of -2.73 suggests a low likelihood of earnings manipulation, which should reassure investors about the integrity of financial reporting. Furthermore, the expanding operating margin is a positive sign, indicating improved efficiency and potential for better profitability in the future. However, the dividend yield near a 10-year low may deter income-focused investors. Overall, while there are positive aspects to AT&T’s financial health, the warning signals warrant a cautious investment approach.
Insider Silence Amid High Institutional Confidence
The insider trading activity for company T over the past year indicates no transactions by company insiders, as there have been zero insider buy or sell actions reported in the 3-, 6-, and 12-month periods. This lack of activity might suggest a stable view from insiders regarding the company’s current valuation or future prospects, possibly indicating no significant changes in insider sentiment.
Insider ownership stands at 0.16%, which is relatively low, suggesting that the company’s directors and management do not hold a substantial stake in the company. This low level of insider ownership could imply limited alignment with shareholder interests. Here, insiders may not be sufficiently incentivized to influence company performance directly.
On the other hand, institutional ownership is significant at 59.76%, indicating strong confidence from institutional investors in the company’s performance and strategy. Such a high percentage of institutional ownership typically reflects a robust endorsement of the company’s fundamentals and future outlook, possibly providing stability to the stock price despite the lack of insider trading activity.
Assessing AT&T Stock’s Trading Activity and Market Dynamics
The liquidity and trading analysis for T reveals a significant level of market activity and interest. The recent trading volume for the day stands at 26,028,843 shares, below the average daily trade volume of 34,047,224 shares over the past two months. This indicates a potential decrease in trading interest or market activity compared to the recent average.
The Dark Pool Index (DPI) for T is 55.41%. A DPI above 50% suggests that a majority of the trades are being executed in dark pools rather than on public exchanges. This could imply that institutional investors are actively trading T, possibly to maintain anonymity and minimize market impact.
Overall, T exhibits strong liquidity, as evidenced by its substantial average daily trading volume. However, the current lower trading volume might warrant monitoring for any developing trends. The high DPI percentage could also suggest strategic positioning by larger market participants.
T’s Government Contracts: A Trend of Strategic Growth
The provided data indicates a steady increase in government contract amounts over four years for T. In 2020, T received $1.2 million, which increased to $1.5 million in 2021. The upward trend continued with $1.8 million in 2022 and peaked at $2.1 million in 2023. This growth suggests T’s enhanced capability to secure larger contracts, potentially due to improved services or expanded offerings, positioning it as a reliable partner for government projects.
Congressional Moves: A Shift in AT&T Investments
Analyzing recent trades by Congress members as a final point for ‘Is AT&T Stock a Buy Now?’, we observe two transactions involving the sale of T shares. On September 4, 2024, Representative John James, a Republican from the House of Representatives, sold shares valued between $1,001 and $15,000. Earlier in the year, Representative Carol Devine Miller, also a Republican from the House of Representatives, executed a similar sale of T shares on May 8, 2024, with the same valuation range.
Both transactions highlight a potential shift or diversification strategy among Republican representatives, possibly indicating changes in their investment portfolios or market expectations regarding T. The close timing of these sales might suggest a broader trend regarding the stock’s performance or outlook.
Disclosures:
Yiannis Zourmpanos has a beneficial long position in the shares of T either through stock ownership, options, or other derivatives. This report has been generated by our stock research platform, Yiazou IQ, and is for educational purposes only. It does not constitute financial advice or recommendations.