


Hut 8’s Core Business Segments and Revenue Breakdown
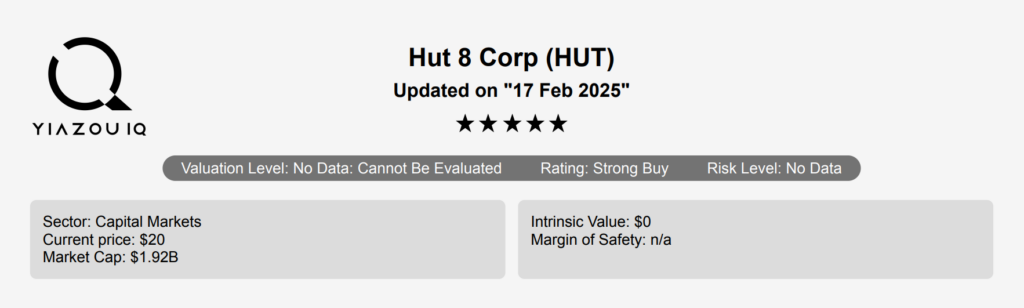
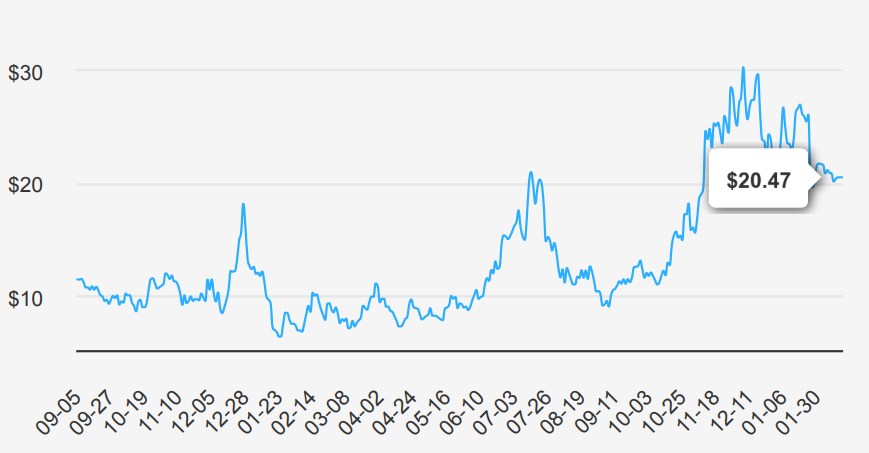
Hut 8 Corp do mining of digital assets with an operational focus on utilizing specialized equipment to solve complex computational problems to validate transactions on the Bitcoin blockchain and receiving Bitcoin in return for successful services. The company has four reportable business segments: Digital Assets Mining, Managed Services, High Performance Computing -Colocation and Cloud, and Other. It derives maximum revenue from the Digital Assets Mining segment. Hut 8 stock is currently trading at ~$20.5.
EPS Recovery, Revenue Surge, and Future Projections
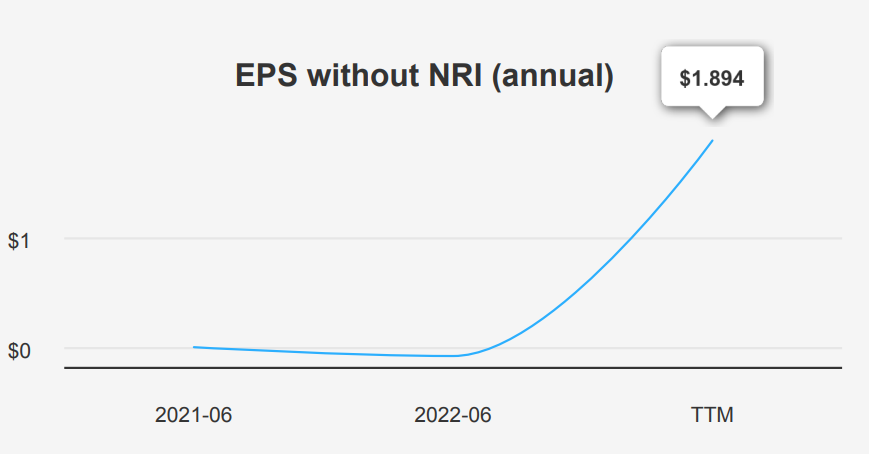
In the third quarter ending September 30, 2024, HUT reported an EPS without NRI (excludes non-recurring items) of -$0.058, an improvement from -$0.974 in Q2 2024, yet a decline from $2.782 in Q1 2024. Compared to the same period last year, the EPS without NRI showed a slight decrease from -$0.043. The EPS (diluted) was $0.01, recovering from a negative $0.78 in Q2 2024 and slightly up from -$0.049 in Q3 2023. Revenue per share was $0.438, a recovery from -$0.406 in the previous quarter, indicating a positive turnaround in revenue generation.
HUT’s gross margin for the quarter was 77.95%, higher than the 5-year median of 67.44%, marking the highest point in the last decade. Despite the absence of share repurchases over the last five years, the 1-year share buyback ratio was -5.60%, reflecting a slight increase in shares outstanding rather than a buyback. A buyback ratio indicates the proportion of a company’s shares repurchased; here, the negative value suggests no buybacks but rather an issuance of shares.
Looking ahead, analysts forecast a robust industry growth of ~10% annually over the next decade. HUT may post an EPS of 2.931 for the next fiscal year, with a subsequent decrease to 0.493 the following year. Analysts project revenue to rise significantly from $169.42 million in 2024 to $547.13 million by 2026. The next earnings report is on March 3, 2025, which will provide further insights into Hut 8 stock trajectory and future performance expectations.
ROIC vs. WACC—A New Era of Profitability?
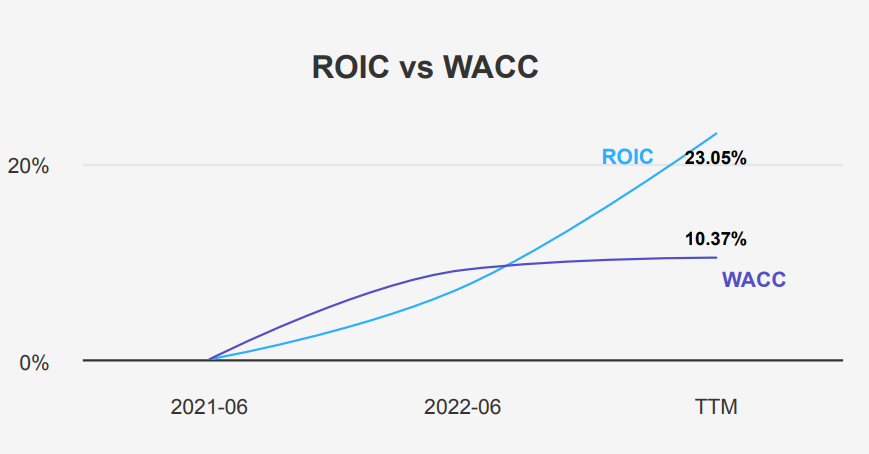
HUT’s financial performance and capital allocation can be evaluated by comparing its Return on Invested Capital (ROIC) with its Weighted Average Cost of Capital (WACC). Over the last five years, the median ROIC was 7.37%, which was lower than the WACC of 9.11%, indicating that during this period, HUT struggled to generate value above its cost of capital. However, the current ROIC has significantly improved to 23.05%, surpassing the WACC of 10.37%. This improvement suggests that the company is now generating economic value, as its ROIC exceeds the cost of capital.
The substantial increase in ROIC reflects better capital efficiency and potentially improved operational performance. Despite past challenges, as indicated by the negative five-year median Return on Assets (ROA) and Return on Equity (ROE), the current positive ROE of 35.91% and ROIC signal effective capital allocation strategies and enhanced profitability.
Overall, HUT’s recent performance indicates successful value creation, with current operations generating returns well above the capital costs.
Debt, Valuation Concerns, and Hut 8 Stock Red Flags Investors Must Know
Hut 8 stock presents a mixed risk profile with several red flags and some positive indicators. The issuance of $204.549 million in new debt over the past three years suggests a reliance on debt financing, which could pose long-term financial risks, especially given the company’s recorded operating income loss in this period. This raises concerns about its operational efficiency and ability to generate profits. The low tax rate appears to artificially enhance earnings, which may not be sustainable if tax regulations change.
The Beneish M-Score of 4.72 indicates potential financial manipulation, suggesting caution in relying solely on reported figures. The forward PE ratio exceeding the trailing PE ratio, along with declining earnings, points to a potential overvaluation of the stock, which is further compounded by a Sloan ratio of 59.37%. This suggests a significant portion of earnings is accrual-based. It increases the likelihood of volatility in future performance.
However, the Altman Z-score of 4.13 is a positive sign, indicating financial stability and a lower risk of bankruptcy in the short term. Investors should weigh these factors carefully, considering both the potential for financial instability and the company’s current solvency strength.
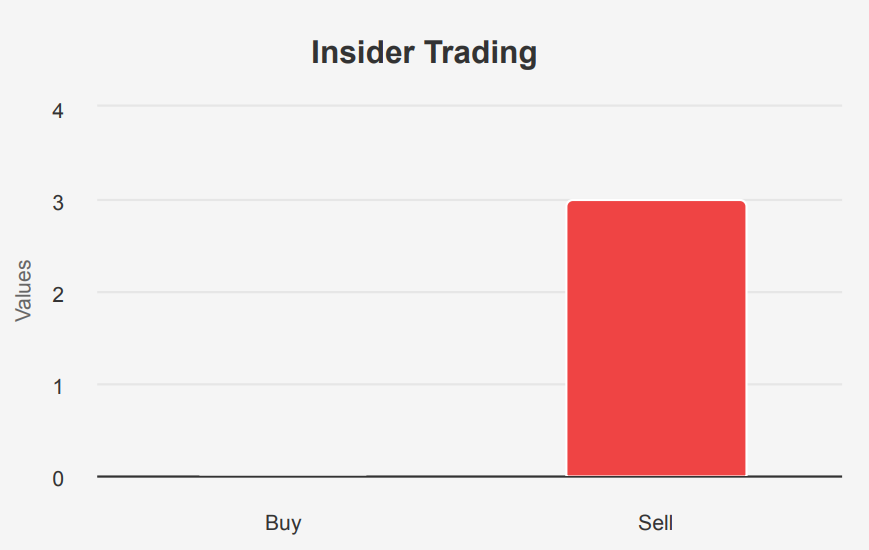
What Low Insider Buying Means for Investors
Over the past year, Hut 8 stock has seen minimal insider trading activity, with zero insider buys recorded and a total of three insider sales. In the last six months, there was one insider sale, and in the most recent three months, no insider trading actions. This lack of buying activity might suggest that insiders are not currently perceiving the stock as undervalued, at least not to the extent that would prompt personal investment.
Insider ownership stands at 10.98%, indicating that insiders hold a moderate stake in the company, which can align management interests with those of shareholders. Meanwhile, institutional ownership is relatively high at 46.65%, suggesting that the company has significant backing from institutional investors, which can be a positive signal for stability and confidence in the company’s operations and future prospects.
Overall, while the absence of insider buys points to a lack of bullish sentiment among insiders, the existing ownership structure reflects a balanced scenario that might appeal to conservative investors.
Declining Volume and Market Volatility Risks
HUT stock’s liquidity profile shows a notable gap between its current volume and the average daily trade volume over the past two months. The average daily trade volume stands at approximately 5,391,073 shares, while the volume on the most recent trading day was 2,202,892 shares. This represents a significant reduction in trading activity, with the latest daily volume being about 40.9% of the two-month average. Such a decrease may indicate lower investor interest or market activity concerning HUT, potentially affecting the ease with which large positions can enter or exit without causing substantial price movements.
In terms of trading dynamics, the Dark Pool Index (DPI) is at 39%. A lower DPI value often suggests that a smaller portion of trades is on dark pools, implying that a larger percentage of trading is taking place on traditional exchanges. This might enhance price transparency and market depth but could also increase the stock’s susceptibility to volatility, as trades are more visible to the broader market.
Overall, these metrics suggest that while HUT remains relatively liquid, the reduced trading volume and low DPI could influence its market behavior, potentially leading to increased volatility in the absence of significant market participants.
Disclosures:
On the date of publication, Yiannis Zourmpanos did not hold (either directly or indirectly) any positions in the securities mentioned in this article. This report has been generated by our stock research platform, Yiazou IQ, and is for educational purposes only. It does not constitute financial advice or recommendations.