
HPE Stock: Invest In Enterprise Solutions From Edge to Cloud Explained
Hewlett Packard Enterprise (HPE) is an information technology vendor that provides hardware and software to enterprises. Its primary product lines are compute servers, storage arrays, and networking equipment; it also has a high-performance computing business. HPE’s stated goal is to be a complete edge-to-cloud company. Its portfolio enables hybrid clouds and hyper-converged infrastructure. It uses a primarily outsourced manufacturing model and employs 60,000 people worldwide. HPE stock is currently trading ~$22. Let’s explore the HPE Stock Forecast in detail.

Earnings Climb 16% YoY—Revenue Hits $6.16 per Share
In the latest quarter ending October 31, 2024, Hewlett Packard Enterprise (HPE) reported an EPS without NRI (excluding nonrecurring items) of $0.58, reflecting a quarter-over-quarter (QoQ) increase from $0.50 in Q3 2024 and year-over-year (YoY) growth from $0.52 in Q4 2023. The diluted EPS significantly rose to $0.99, compared to $0.38 in the previous quarter and $0.49 a year earlier, suggesting strong profitability improvements. Revenue per share reached $6.16, up from $5.788 in Q3, indicating healthy top-line growth. The 5-year Compound Annual Growth Rate (CAGR) for annual EPS without NRI is 5.90%, while the 10-year CAGR is 3.30%.
HPE’s gross margin stood at 32.79% this quarter, slightly below the 5-year median of 33.36%, indicating stable cost management despite industry pressures. The company’s buyback strategy has recently turned negative, with a 1-year buyback ratio of -1.10%, implying a net issuance of shares rather than repurchases. Over the past decade, the 10-year share buyback ratio was 3.80%, reflecting a historical pattern of buying back 3.80% of its shares, enhancing EPS by reducing the number of shares outstanding.
Industry forecasts predict a 10-year growth rate of around 5% annually, aligning with HPE’s strategic focus on high-growth areas such as edge-to-cloud solutions. Analysts estimate HPE’s revenue to grow to $32.56 billion by 2025 and project EPS to reach $1.770 in the next fiscal year, further increasing to $2.004 in the following year. These projections underscore a positive outlook, supported by robust market demand and strategic investments. The next earnings release is on February 28, 2025, offering further insights into HPE Stock Forecast.

ROIC vs. WACC: Challenges in Delivering Shareholder Value
HPE shows a mixed picture in terms of economic value creation when analyzing its Return on Invested Capital (ROIC) against its Weighted Average Cost of Capital (WACC). Over the past five years, HPE’s median ROIC is 4.47%, which is below its median WACC of 6.86%. This indicates that, on average, HPE has not been generating sufficient returns to cover its cost of capital, potentially leading to value erosion for shareholders under HPE Stock Forecast.
However, the most recent ROIC figure of 4.54% still falls short of the latest WACC of 8.34%, reinforcing the trend of underperformance in terms of capital efficiency. This suggests that HPE is not currently creating economic value, as its capital investments are yielding returns lower than the capital’s cost.
Despite this, HPE has shown a relatively strong return on equity (ROE) at 11.60%, indicating competent equity management. Yet, without improvement in ROIC relative to WACC, the company might struggle to sustainably enhance shareholder value. Therefore, HPE needs strategic initiatives to boost its operational efficiency or cost of capital management to reverse this trend.

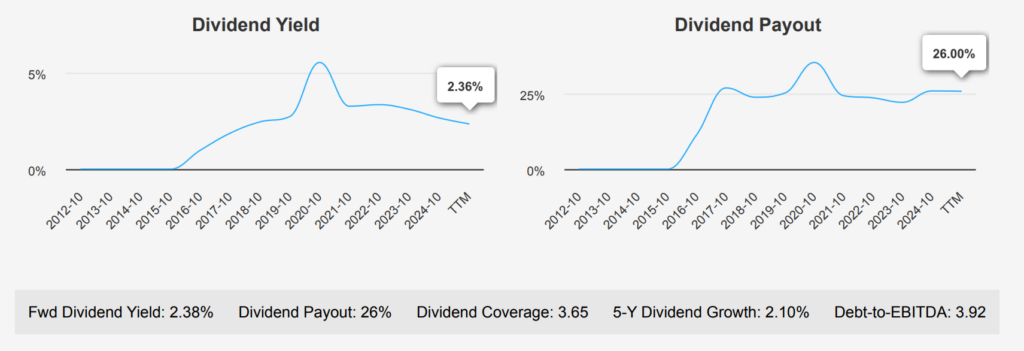
Dividend Growth Steady at 2.7%, Yield Slightly Below Historical Median
Hewlett Packard Enterprise’s (HPE) recent dividend growth reveals a steady upward trajectory. The company’s 3-year dividend growth rate per share stands at 2.70%, slightly above the 5-year rate of 2.10%, indicating consistent dividend increases. This growth trajectory is bolstered by a forward dividend yield of 2.38%, which, while below the 10-year median yield of 2.84%, showcases stability in payouts.

In terms of financial leverage, HPE’s Debt-to-EBITDA ratio is 3.92, placing it in the moderate risk category. This suggests that while the company’s debt levels are manageable, they warrant attention, especially given the industry comparison guidelines. The dividend payout ratio is currently at a conservative 26.0%, significantly lower than its 10-year high. This low payout ratio indicates ample room for future dividend growth despite external pressures.
HPE’s forecasted dividend growth rate for the next 3-5 years is 2.64%, aligning with historical growth patterns. The next ex-dividend date is December 20, 2024, suggesting a dividend frequency of quarterly payments. With this schedule, the subsequent ex-dividend date would likely fall around March 20, 2025, provided it lands on a weekday and not a weekend.
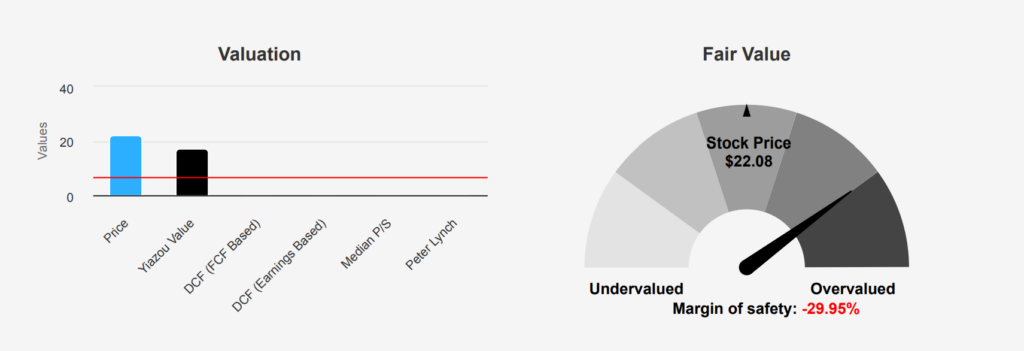
HPE Intrinsic Value Falls 30% Below Current Market Price
Hewlett Packard Enterprise’s (HPE) current intrinsic value is estimated at $16.99, significantly below its current market price of $22.08, resulting in a negative margin of safety at -29.96%. This suggests the stock holds overvaluation relative to its intrinsic worth. The Forward P/E ratio stands at 10.37, slightly lower than its TTM P/E of 11.62, indicating modest expectations for future earnings growth. Historically, the P/E ratio has swung between 4.28 and 212.71, with a median of 11.63, showing that the current valuation is near its historical median.
The TTM Price-to-Sales (P/S) ratio is 0.99, compared to a 10-year median of 0.74, suggesting a slight overvaluation relative to sales. The EV/EBITDA ratio at 6.72 is slightly above its historical median of 6.24 but remains well within its historical range. The TTM Price-to-Book (P/B) ratio is 1.15, above its 10-year median of 0.99, indicating the stock holds a higher price relative to its book value than its historical average. Notably, these metrics suggest some valuation concerns, especially when compared to historical norms.
Analyst sentiment appears cautiously optimistic, with the latest price target at $24.27, up from $23.54 a month ago, despite the intrinsic value assessment suggesting overvaluation. With 18 analyst ratings and a slight increase in price targets over recent months, there is a moderate consensus for potential upside, albeit the stock’s valuation metrics suggest a careful approach. Overall, while some trends under HPE Stock Forecast point to overvaluation, the stock’s reasonable Forward P/E and modest EV/EBITDA ratios indicate it may still hold potential for investors willing to accept some risk.
HPE Stock: Debt, Insider Selling, and Valuation Risks—Balanced by Expanding Margins
Hewlett Packard Enterprise Co (HPE) presents a mixed risk profile. On the concerning side, the company has been increasing its debt load significantly, issuing $4.9 billion over the past three years, which could strain financial flexibility despite being deemed acceptable overall. Insider selling activity is high, with 1,085,868 shares sold and no insider buys, potentially signaling a lack of confidence from those closest to the company. Additionally, the Altman Z-score in the distress zone at 1.03 indicates a heightened risk of financial distress, suggesting possible bankruptcy within two years if conditions do not improve. The stock’s price and PS ratio being near 10-year highs may also point to overvaluation risks.
On the positive side, the company is not showing signs of financial manipulation, as indicated by its Beneish M-Score. Furthermore, HPE’s expanding operating margin is a favorable indicator, suggesting improved efficiency and profitability. However, the return on invested capital is lower than the weighted average cost of capital, which questions capital efficiency. The dividend yield nearing a five-year low might also concern income-seeking investors. Overall, while there are positive operational signs, the financial risks and potential overvaluation necessitate cautious consideration under HPE Stock Forecast.
High Insider Selling but Strong Institutional Ownership For HPE Stock
The insider trading data for Hewlett Packard Enterprise (HPE) over the past year reveals a consistent pattern of selling activity by the company’s directors and management. In the last three months alone, there have been 18 insider sale transactions, and no insider purchases were recorded. This trend extends over six and twelve months, with 23 and 32 insider sales respectively, and no buys.
This selling activity might indicate that insiders perceive the current share price as favorable for profit-taking or that they are reallocating their personal financial portfolios. However, it’s important to note that insider selling does not necessarily imply negative prospects for the company, as it can also be driven by personal financial needs or diversification strategies.
Insider ownership stands at 0.38%, which is relatively low, suggesting that insiders do not have a significant personal stake in the company. In contrast, institutional ownership is high at 96.49%, indicating that the company’s stock is largely held by institutional investors, which can often imply confidence in long-term performance under HPE Stock Forecast.

HPE Stock Sees 80% Jump in Daily Trading Volume
HPE stock demonstrates significant liquidity in the market, evidenced by its recent daily trading volume of 25,619,567 shares. This figure substantially surpasses the 2-month average daily trading volume of 14,072,752 shares, indicating heightened investor interest or market activity. The Dark Pool Index (DPI) for HPE stands at 58.58%, suggesting that over half of the trading volume occurs in dark pools. This level of activity can imply that institutional investors are actively trading HPE shares, potentially due to strategic movements or adjustments in their portfolios.
The high trading volume relative to its average suggests that HPE is a liquid stock, providing investors with the ability to enter or exit positions with relative ease. This liquidity is beneficial for both retail and institutional investors as it reduces the risk of price slippage during large trades. The substantial proportion of dark pool trading also implies that significant trades could occur that are not immediately visible in the public markets, possibly affecting price discovery and volatility.
Overall, HPE’s current liquidity and trading dynamics suggest an active market presence, with robust interest from both retail and institutional investors.
Diverging Congressional Trades Reflect Mixed Views on HPE
The analysis of recent significant trades by members of Congress involving HPE reveals distinct approaches from different political affiliations and transaction types. On March 18, 2020, Representative Gilbert Cisneros, a Democrat from the House of Representatives, completed a sale of HPE stock, falling within the $1,001 – $15,000 range. This action was reported on April 16, 2020, possibly indicating a strategic divestment during a volatile market period amid the early days of the COVID-19 pandemic.
In contrast, Republican Representative Bill Flores from the House made a purchase of HPE stock on May 8, 2019, which was also in the same financial range. This transaction was reported on June 13, 2019, and could suggest a perceived value or anticipation of growth in the tech sector at that time. These transactions highlight differing strategies and market perceptions across party lines, reflecting how external economic conditions and personal financial strategies influence Congressional trades.
Disclosures:
Yiannis Zourmpanos has a beneficial long position in the shares of HPE either through stock ownership, options, or other derivatives. This report has been generated by our stock research platform, Yiazou IQ, and is for educational purposes only. It does not constitute financial advice or recommendations.
