
HPE Stock: Edging On Core Business & Edge-to-Cloud Strategy
Hewlett Packard Enterprise (HPE) is an information technology vendor that provides hardware and software to enterprises. Its primary product lines are compute servers, storage arrays, and networking equipment; it also has a high-performance computing business. HPE’s stated goal is to be a complete edge-to-cloud company. Its portfolio enables hybrid clouds and hyper-converged infrastructure. It uses a primarily outsourced manufacturing model and employs 60,000 people worldwide. HPE stock is currently trading near $21.34. Lets explore HPE stock forecast 2025.
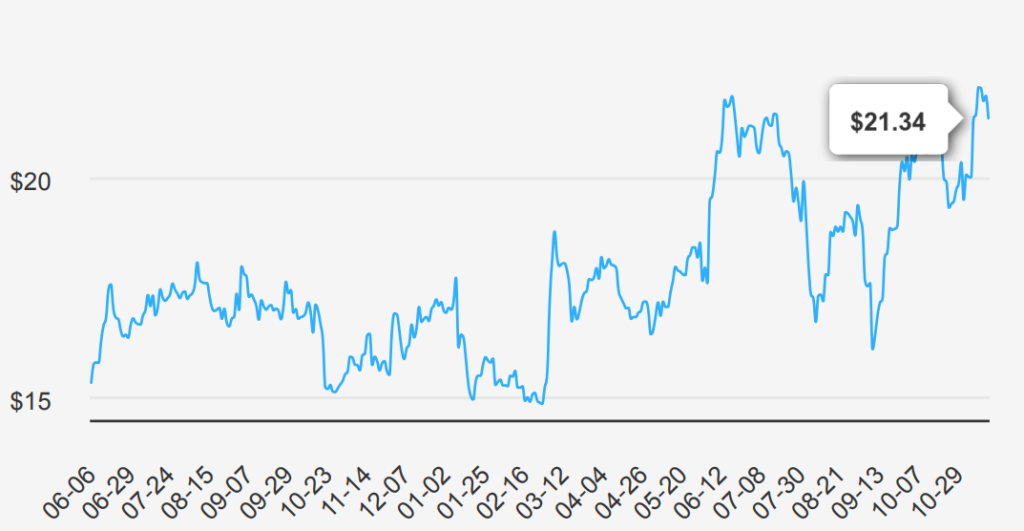
Quarterly Earnings & Long-Term Growth Prospects (2024-2026)
Hewlett Packard reported its earnings for the quarter ending July 31, 2024, with an EPS without non-recurring items (NRI) of $0.50, marking an increase from $0.42 in the previous quarter but a slight decrease from $0.49 in the same quarter last year. The EPS (Diluted) stood at $0.38, compared to $0.24 in the previous quarter and $0.35 a year ago. Revenue per share increased to $5.788, up from $5.437 in the previous quarter and $5.321 in the same quarter last year. Over the past five years, HPE has achieved a 7.00% CAGR in annual EPS without NRI and a 2.90% CAGR over ten years.
HPE’s gross margin for the quarter was 33.88%, slightly above its five-year median of 33.36% and significantly better than its ten-year median of 32.33%. The company’s share buyback ratio over the last year was -1.20%, indicating a net issuance rather than repurchase of shares, contrasting with a moderate 1.50% buyback ratio over five years. The buyback ratio is a useful measure of how much of the company’s shares have been repurchased as a percentage of the total shares previously outstanding.
Looking ahead, analysts estimate HPE’s revenue to reach $29,934.51 million by October 2024, with a further increase to $33,326.11 million by October 2026. The estimated EPS for the next fiscal year is $1.619, rising to $1.737 the following year. The next earnings report is on November 28, 2024, which will provide further clarity on HPE’s financial trajectory and the impact of ongoing market conditions. Industry growth for the next decade may be around 6%, aligning with HPE’s strategic initiatives to capture significant market share.

HPE’s Capital Allocation and Return Efficiency: ROIC vs. WACC
One can assess Hewlett Packard Enterprise’s financial performance, in terms of capital allocation and economic value creation, by comparing its Return on Invested Capital (ROIC) with its Weighted Average Cost of Capital (WACC). Over the past five years, HPE’s median ROIC stands at 4.30%, lower than the median WACC of 6.14%. This indicates that, on average, HPE has not been covering its cost of capital, suggesting that it has been destroying value rather than creating it. In the most recent period, HPE’s ROIC is 4.22%, also below the current WACC of 8.50%, continuing the trend of negative value creation under HPE stock forecast 2025.
However, there is a notable disparity when considering the Joel Greenblatt ROC (5-year median) of 33.91%, suggesting efficiency in capital utilization under specific metrics. Despite this, the
traditional ROIC measure shows inadequacy in surpassing WACC. The recent ROE of 8.67% indicates some improvement in shareholder returns, but further enhancement in capital efficiency is still required to ensure consistent value creation. Overall, HPE needs to improve its capital allocation strategies to increase ROIC above WACC, thus creating positive economic value.

Dividend Growth Analysis: Yields, Payout Ratios, and Debt Levels
Hewlett Packard Enterprise stock has demonstrated a modest dividend growth over recent years, with a 5-year growth rate of 4.20%. The dividend has been $0.13 per share in recent quarters. The forward dividend yield is 2.43%, slightly below its 10-year median yield of 2.85%, but still competitive within its sector.

The company’s Debt-to-EBITDA ratio is 2.43, which falls within the moderate range. This suggests some financial leverage, but it remains manageable. The dividend payout ratio is low at 27.0%, indicating a conservative approach to dividend distribution relative to earnings and providing ample room for potential increases, assuming earnings remain stable or grow under HPE stock forecast 2025.
Looking ahead, the forecasted 3-5 year dividend growth rate may be at 4.98%, which suggests potential for future dividend increases, aligning with historical trends. Given the dividend frequency of four times per year, and with the last ex-dividend date on 2024-09-19, the next ex-dividend date is on 2024-12-19, a Thursday. This regular schedule supports investor income predictability despite recent growth stagnation.

Valuation Insights: Is HPE Stock Overpriced or Fairly Valued?
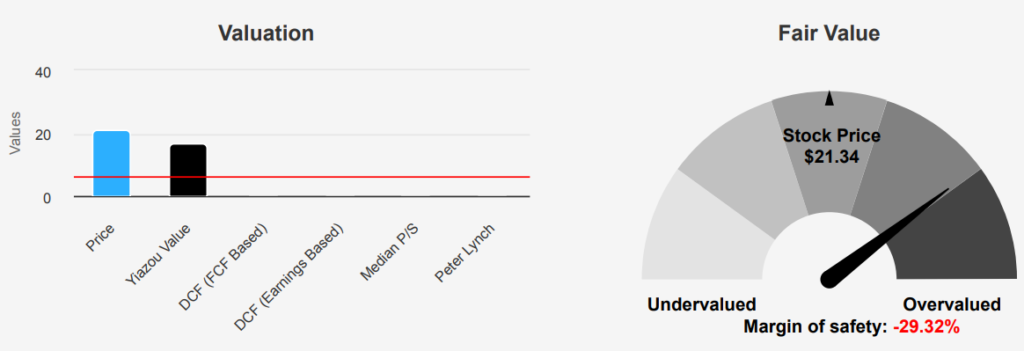
Hewlett Packard Enterprise is currently trading at $21.34, above its intrinsic value of $16.5, indicating a negative margin of safety of -29.33%. This suggests that the stock is potentially overvalued. The current P/E ratio TTM of 15.24 is above the 10-year median of 12.23 but significantly below its historical high of 212.71, suggesting a more stable valuation context compared to extreme past values. The forward P/E ratio of 10.14 indicates earnings growth expectations, potentially justifying the current market price if realized.
Analyzing other valuation metrics, the EV/EBITDA TTM of 7.53 is slightly above its 10-year median of 6.22 but comfortably within the historical range, indicating that the company may be at fair value when considering its earnings before interest, taxes, depreciation, and amortization. The TTM P/S ratio of 1 is near its historical high, reflecting higher revenue multiples than the past median of 0.74. The P/B ratio TTM of 1.26 is above the 10-year median of 0.99, which could signal overvaluation unless justified by significant asset appreciation.
Analyst ratings and price targets suggest a stable outlook for HPE, with the current stock price closely aligning with the latest price target of $21.278750. This consistency over recent months suggests market expectations are stable, with analysts anticipating no significant upside or downside. However, given the intrinsic value analysis and other valuation metrics, prospective investors should consider the possibility of a limited margin of safety and evaluate whether current market conditions and future growth prospects justify this valuation.
Risk Assessment: Insider Activity, ROIC, and Financial Distress Indicators
Hewlett Packard Enterprise presents a mixed risk profile. Notable concerns include significant insider selling, with 592,678 shares disposed of over the past three months, which could signal a lack of confidence from the management team. The company’s price-to-book (PB) and price-to-sales (PS) ratios are near their 10-year highs at 1.28 and 1, respectively, suggesting an overvaluation. Additionally, the Altman Z-score of 0.93 places HPE in the distress zone, indicating a higher risk of financial instability or potential bankruptcy under HPE stock forecast 2025.
Despite these red flags, there are positive indicators that may mitigate some risks. HPE has a Piotroski F-Score of 7, signifying overall financial health, and a Beneish M-Score of -2.71, indicating a low likelihood of earnings manipulation. The company’s operating margin is expanding, a favorable sign of operational efficiency. However, the return on invested capital is currently lower than the weighted average cost of capital, suggesting inefficiencies in capital utilization. Prospective investors should weigh these factors carefully and consider the potential for revenue challenges, as indicated by the declining revenue per share.
Overall, caution is advised, given the mixed signals regarding the company’s financial health and market valuation.
Insider Activity Trends On HPE Stock: Selling Patterns & Institutional Ownership
Under HPE stock forecast 2025, the insider trading activity for Hewlett Packard Enterprise stock over the past year reveals a significant trend of selling among the company’s directors and management. In the last three months alone, there have been no insider purchases, while there have been six sell transactions. This pattern persists over the six-month and twelve-month periods, with 11 and 25 insider sales, respectively, and again, no recorded buys.
This consistent selling trend may suggest that insiders are capitalizing on current stock valuations or possibly anticipating a downturn. The lack of buying could indicate a lack of confidence in the stock’s growth potential from those most familiar with the company’s operations.
Insider ownership at HPE is relatively low at 0.38%, which may mean that insiders do not have a substantial personal financial stake in the company. Meanwhile, institutional ownership stands high at 82.28%, indicating that the majority of the company’s shares are held by large financial institutions, potentially contributing to stability but also suggesting that insider trades have less impact on overall market perception.

Liquidity & Trading Trends: Volumes and Dark Pool Index
Under HPE stock forecast 2025, the stock shows a current daily trading volume of 7,987,835 shares, which is considerably lower than its average daily trading volume of 13,127,575 shares over the past two months. This discrepancy suggests a decrease in trading activity, which could affect the stock’s price volatility and liquidity.
The Dark Pool Index (DPI) stands at 43.66%, indicating that a significant portion of HPE’s trades are being executed in dark pools rather than on public exchanges. A high DPI percentage suggests institutional investors may engage in large trades, potentially minimizing market impact and price fluctuations. However, it also implies less transparency in trading, which could affect retail investors’ ability to gauge true market sentiment.
Overall, the reduced trading volume may lead to wider bid-ask spreads, making it more challenging for investors to execute large trades without impacting the stock price. The relatively high DPI percentage highlights the importance of monitoring institutional trading activities to better understand market dynamics for HPE. Investors should consider these factors when evaluating the stock’s liquidity and market conditions.
Congressional Trades On HPE Stock: Implications of Legislative Members’ Transactions
Analyzing the trading activities for Hewlett Packard Enterprise involving two members of the House of Representatives, we observe contrasting actions. On March 18, 2020, Gilbert Cisneros, a Democrat, reported a sale of HPE stock valued between $1,001 and $15,000. This transaction occurred during a period of heightened market volatility due to the early impact of the COVID-19 pandemic, potentially influencing Cisneros’s decision to liquidate assets.
In contrast, Bill Flores, a Republican, reported purchasing the same stock on May 8, 2019, for a similar value range. This acquisition took place during a relatively stable market period, which might have been driven by strategic investment intentions. These trades highlight differing approaches and timings in financial decision-making by representatives from both parties, potentially reflecting their respective views on market conditions and company performance during those periods.
Disclosures:
On the date of publication, Yiannis Zourmpanos did not hold (either directly or indirectly) any positions in the securities mentioned in this article. This report has been generated by our stock research platform, Yiazou IQ, and is for educational purposes only. It does not constitute financial advice or recommendations.
