ExxonMobil Stock Represents Global Energy Powerhouse with Expansive Reach
ExxonMobil (XOM) is an integrated oil and gas company that explores for, produces, and refines oil worldwide. In 2023, it produced 2.4 million barrels of liquids and 7.7 billion cubic feet of natural gas per day. At the end of 2023, reserves were 16.9 billion barrels of oil equivalent, 66% of which were liquids. The company is one of the world’s largest refiners, with a total global refining capacity of 4.5 million barrels of oil per day. It is one of the world’s largest manufacturers of commodity and specialty chemicals. ExxonMobil stock is trading at $113.

Steady Growth: Earnings Rise Amid Energy Shift
ExxonMobil reported earnings per share (EPS) without non-recurring items (NRI) of $2.14 for Q2 2024. This reflects a slight increase from $2.06 in Q1 2024 but a decrease from $2.48 in Q4 2023. Compared to the same quarter last year, EPS improved from $1.94, indicating a year-over-year (YoY) growth. Revenue per share also saw a modest increase to $20.845 from $20.113 QoQ. Over the past five and ten years, the compound annual growth rate (CAGR) for annual EPS without NRI has remained steady, showing resilience in fluctuating market conditions.
Gross margins for XOM stood at 23.25%, slightly below its five-year median of 23.45% but well within the range seen over the past decade. The company’s share buyback activities have fluctuated, with a 10-year buyback ratio of 0.40%. It indicates a consistent repurchase of shares over time. However, the company reduced its buyback activities over the past year, with a -11% ratio. This suggests fewer shares were repurchased, impacting EPS performance.
Analysts estimate a positive outlook for XOM, with EPS expected to reach $8.625 by the end of the next fiscal year and $9.393 the following year. Despite market volatility, these forecasts suggest confidence in XOM’s sustained earnings growth. The company will reveal further insights into its performance and strategic adjustments during the next earnings announcement, anticipated on October 25, 2024.

Consistent Value Creation Through Smart Capital Allocation
ExxonMobil demonstrates effective capital allocation and economic value creation, as evidenced by its Return on Invested Capital (ROIC). This consistently exceeds its Weighted Average Cost of Capital (WACC). With a recent ROIC of 9.60%, XOM surpasses its WACC of 6.02%, indicating that the company is generating positive economic value. Over the past five years, XOM’s median ROIC of 5.93% approached but did not always exceed the median WACC of 7.97%. This suggests fluctuations in value creation efficiency over time.
The company’s ROE of 15.86% also signifies robust financial performance. Exceeding both the five-year median of 14.15% and reflecting a strong ability to generate profits from shareholders’ equity. The historical highs and lows of ROIC and WACC further illustrate the variability in performance, with a peak ROIC of 16.92% and a low of -7.69%. This indicates periods of significant value creation and challenges.
Overall, XOM’s current financial metrics suggest it efficiently utilizes its capital to generate value beyond its cost of capital. This contributes positively to shareholder wealth.

The Stock Provides Stable Dividends Backed by Strong Fundamentals
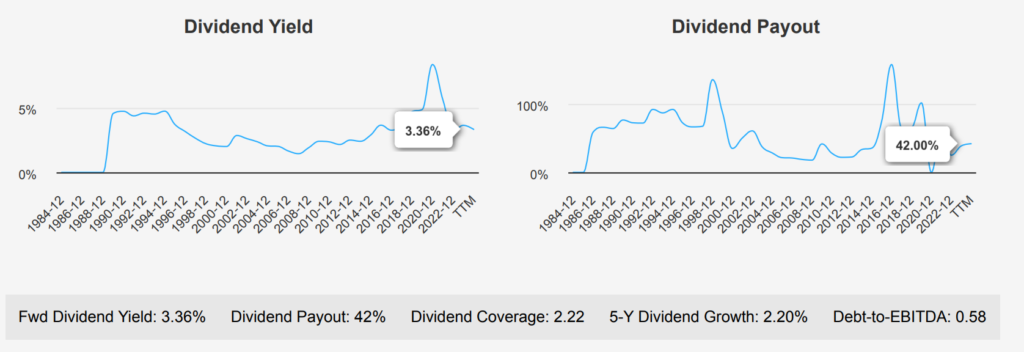
Exxon Mobil Corporation has demonstrated a stable but modest dividend growth trend, with a 5-year growth rate of 2.20% and a 3-year rate of 1.90%. Most recently, XOM declared a quarterly dividend of $0.95 per share, maintaining the amount from the previous two quarters. This reflects a stable dividend strategy following a previous increase from $0.91 per share. This consistency aligns with the company’s strong financial position, underscored by a low Debt-to-EBITDA ratio of 0.58. This indicates robust debt-servicing capabilities well below industry caution levels.

The company’s forward dividend yield stands at 3.36%, slightly below its 10-year median yield of 3.72%. It suggests a stable yield profile compared to past performance. XOM’s dividend payout ratio is currently 42.0%, significantly lower than its historical highs, providing ample room for future increases. The projected 3- 5 year dividend growth rate of 4.29% suggests cautious optimism for moderate growth moving forward.
The next ex-dividend date is expected on November 14, 2024, ensuring investors have a clear timeline for dividend eligibility. Sector comparisons indicate that XOM remains competitive, leveraging its low financial leverage and consistent dividend policy to attract income-focused investors.
ExxonMobil Stock: Mixed Valuation Signals, Undervalued or Overpriced?
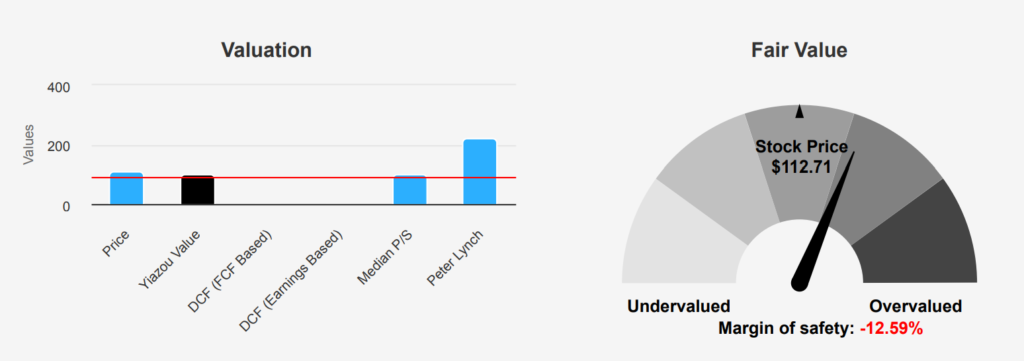
The intrinsic value of XOM stands at $100.1, while its current market price is $112.71, indicating a margin of safety of -12.6%. This suggests that the stock is trading above its intrinsic value, which may point to a potential overvaluation. The Forward P/E ratio is 12.29, below the historical median of 16.21. This could imply that the market expects future earnings growth. However, the stock’s TTM P/E of 13.48 aligns more closely with its 10-year median. It is reinforcing that XOM is not significantly undervalued.
Examining other valuation metrics, the TTM EV/EBITDA ratio is 6.99, slightly below the 10-year median of 7.88. This indicates a relatively fair valuation regarding enterprise value. The TTM P/B ratio is 1.87, below its 10-year median of 1.93. It suggests the stock is trading near its book value norm. The TTM Price-to-Free-Cash-Flow ratio is 14.09, significantly lower than its 10-year median of 23.28, which could point to an undervaluation in terms of cash generation, especially when historical peaks are considered.
Analyst ratings suggest a generally positive outlook, with a price target of $132.02. It indicates a potential upside from the current price. However, the narrow margin suggests that investors should proceed cautiously, given that the current price exceeds the intrinsic value. There is no evident margin of safety. The valuation metrics collectively indicate that XOM is neither significantly overvalued nor offers a compelling value proposition compared to its historical averages.
Balancing Risk & Reward: XOM’s Mixed Signals
Exxon Mobil Corp (XOM) presents a mixed investment profile. On the cautionary side, XOM’s revenue per share has declined over the past year. It suggests potential challenges in sustaining its growth trajectory. The stock price is nearing a 10-year high, which might indicate that the stock is overvalued at current levels. Also, the price-to-sales (PS) ratio of 1.35 is close to its 3-year high, raising concerns about its valuation.
Conversely, Exxon Mobil demonstrates robust financial health. The Beneish M-Score of -2.52 suggests a low risk of earnings manipulation, enhancing its credibility. The price-to-book (PB) ratio of 1.87 is near a 2-year low, indicating potential undervaluation relative to its assets. The company also exhibits strong financial strength, with a healthy balance sheet and an impressive Altman Z-score of 4.21. This indicates a low probability of bankruptcy. These factors collectively suggest that while there are valuation concerns, Exxon Mobil’s financial foundation remains solid. This is potentially offering a cushion against market volatility.
Minimal Insider Trading, Strong Institutional Confidence in XOM
In the last 12 months, there have been 2 insider purchases and 4 insider sales. Within the past 6 months, there was 1 insider purchase against 2 sales, and in the most recent 3 months, there was only 1 purchase with no sales. This suggests a cautious stance from insiders with a slight preference towards selling over the longer term.
Insider ownership remains low at 0.75%, indicating that directors and management hold only a modest stake in the company. This might suggest that insiders do not have substantial personal financial incentives tied directly to stock performance. On the other hand, institutional ownership is quite significant at 63.97%. This highlights strong institutional interest and possibly confidence in the company’s long-term prospects. Overall, the insider trading pattern does not exhibit aggressive buying or selling. It suggests neutral insider sentiment toward the company’s stock performance.

XOM’s Liquidity: Robust Trading and Dark Pool Dynamics
Liquidity & Trading Exxon Mobil Corporation exhibits a high market liquidity level. Its average daily trading volume over the past two months stands at 13,700,616 shares, while the daily volume is 11,665,893 shares. This indicates a strong market presence and consistent investor interest, even if the daily volume is slightly below the two-month average.
Additionally, the Dark Pool Index (DPI) for XOM is 32.83%, reflecting the proportion of trades executed in private exchanges rather than public markets. A DPI of 32.83% suggests a significant amount of trading activity occurs away from public exchanges, which can indicate institutional trading interest and may impact price discovery and volatility.
Overall, the liquidity metrics for XOM suggest a robust and healthy trading environment, with substantial volume and a notable level of institutional interest, as evidenced by the DPI. This environment generally supports efficient price formation and gives investors confidence in executing large transactions with minimal market impact.
Government Contracts: Fluctuating Trends Over Recent Years
ExxonMobil has experienced significant fluctuations in government contract values over the years. In 2023, the company saw a substantial increase to $168 million, reflecting a more than twofold rise from 2022’s $73.8 million. This upward trend continues into 2024, with contracts amounting to $164.5 million. Governmental demand for ExxonMobil’s services notably surpassed the 2019 peak of $122 million in 2023, suggesting a resurgence likely driven by strategic projects or increased energy needs.
Congress Trading: ExxonMobil Stock’s Transactions in Detail
Two notable transactions involving ExxonMobil stock were reported in recent congressional trading activity. On July 17, 2024, Senator Shelley Moore Capito, a Republican from West Virginia, conducted a partial sale of XOM shares valued between $1,001 and $15,000. The Senate’s disclosure for this transaction was filed on August 11, 2024. Meanwhile, Representative Kevin Hern, a Republican from Oklahoma, purchased XOM shares within the same value range of $1,001 to $15,000 on June 10, 2024, as reported on July 15, 2024.
The timing of these transactions is of interest, as it reflects a potential difference in investment strategy concerning XOM stock between the two legislators. Capito’s sale follows Hern’s purchase by about a month, potentially indicating differing views on the stock’s future performance or a need for liquidity. These trades highlight the ongoing involvement of congressional members in the energy sector, a critical area of the U.S. economy.
Disclosures:
Yiannis Zourmpanos has a beneficial long position in the shares of XOM either through stock ownership, options, or other derivatives. This report has been generated by our stock research platform, Yiazou IQ, and is for educational purposes only. It does not constitute financial advice or recommendations.
