Disney’s Dividend, Entertainment, Sports, and Experiences Breakdown
Disney (DIS) operates in three global business segments: entertainment, sports, and experiences. Entertainment and experiences both benefit from the firm’s ownership of iconic franchises and characters. Entertainment includes the ABC broadcast network, several cable television networks, and the Disney+ and Hulu streaming services. Within the segment, Disney also engages in movie and television production and distribution, with content licensed to movie theaters, other content providers, or, increasingly, kept in-house for use on Disney’s own streaming platform and television networks. The sports segment houses ESPN and the ESPN+ streaming service. Experiences contain Disney’s theme parks and vacation destinations and also benefits from merchandise licensing. For have DIS dividend, investors need to pay $117.6 per share.

EPS Trends and Projected Growth: $4.785 Next Year Amid Revenue Fluctuations
In the latest quarter ending September 2024, Disney reported an EPS without NRI (non-recurring items excluded) of $1.14, a decrease from $1.463 in the previous quarter and an increase from $0.82 in the same quarter last year. The diluted EPS was $0.25, down from $1.43 in the prior quarter but up from $0.14 a year ago. Revenue per share also showed a decline to $12.41 from $12.66 in the previous quarter but increased from $11.588 year-over-year. The five-year CAGR for annual EPS without NRI stands at 4.50%, while the ten-year CAGR is negative at -4.70%. According to industry forecasts, the entertainment sector may grow at an average rate of 4.2% annually over the next decade.
Disney’s gross margin for the quarter was 35.75%, above its five-year median of 33.41% but below the ten-year high of 46.09%. The company’s share buyback ratio over the last year was 1.20%, meaning Disney repurchased 1.20% of its outstanding shares, which can positively impact EPS by reducing the number of shares outstanding. Over a longer perspective, the 10-year buyback ratio is -1.60%, indicating a net issuance of shares over that period. The impact of these buybacks is a contributing factor in stabilizing or enhancing EPS, even when earnings are under pressure.
Looking ahead, Disney may achieve an EPS of 4.785 for the next fiscal year and 5.564 for the following year. Analysts project revenue growth, with estimates reaching $94,767.84 million by September 2025 and $104,854.44 million by September 2027. The next earnings report will be on February 7, 2025, providing further insights into Disney’s performance and strategic direction. Given the current economic climate and industry growth projections, analysts maintain a cautiously optimistic DIS dividend outlook on Disney’s capacity to navigate challenges and capitalize on opportunities for growth.

Disney’s ROIC vs. WACC: Long-Term Value Creation Challenges
Analyzing Disney’s financial performance through its Return on Invested Capital (ROIC) and comparing it with the Weighted Average Cost of Capital (WACC) provides insights into its economic value creation. Over the past five years, Disney’s median ROIC is 2.99%, significantly lower than the corresponding median WACC of 9.81%. This indicates that Disney has not been generating returns that exceed its cost of capital, suggesting a potential destruction of shareholder value over this period.
In the most recent analysis, Disney’s ROIC stands at 4.92%, still below the current WACC of 10.69%. This gap highlights ongoing challenges in achieving financial efficiency and value creation. The ROIC needs to consistently surpass the WACC for Disney to generate positive economic value. Despite achieving a relatively high ROIC of 14.56% within the last decade, the current figures suggest that Disney must enhance its capital allocation and operational efficiency to improve its value generation capabilities and justify its cost of capital expenditures.

Disney’s Dividend Stagnation and Forecasted 16.46% Growth: Risk or Reward?
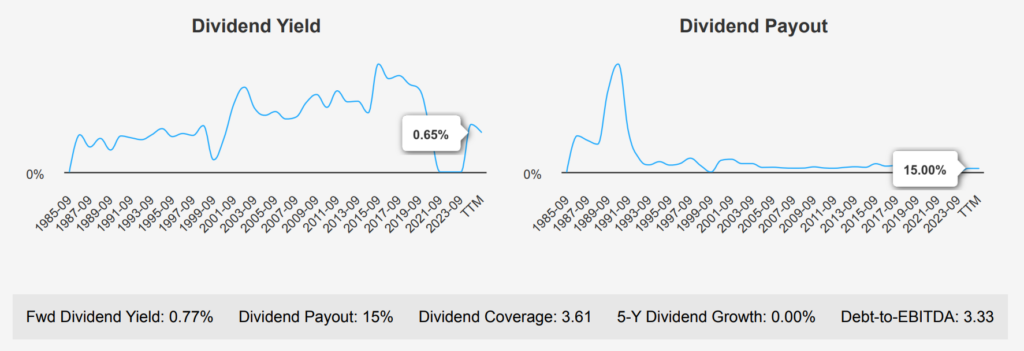
DIS dividend performance reflects a period of stagnation, with both the 5-year and 3-year dividend growth rates at 0.00%. The forward dividend yield is modest at 0.77%, significantly lower than its 10-year median of 1.38%. This suggests a conservative approach to dividend payouts, potentially due to strategic reinvestment or financial constraints.

The company’s Debt-to-EBITDA ratio stands at 3.33, indicating moderate financial leverage. While this is within acceptable limits, it suggests a need for cautious monitoring, given the potential pressures of debt servicing. Compared to the broader sector, Disney’s financial leverage appears typical, though it suggests limited flexibility for aggressive dividend hikes without affecting its debt position.
The forecasted future dividend growth rate of 16.46% is optimistic, possibly reflecting anticipated improvements in earnings or cash flow. However, the flat dividend growth in recent years indicates challenges, likely tied to balancing capital needs and debt management.
The next ex-dividend date is July 8, 2024, which aligns with the bi-annual dividend frequency. This date falls on a weekday, ensuring shareholders can anticipate their DIS dividend regularly without disruption.

Disney Stock Valuation: Overpriced by 9.46% or Strategic Opportunity?
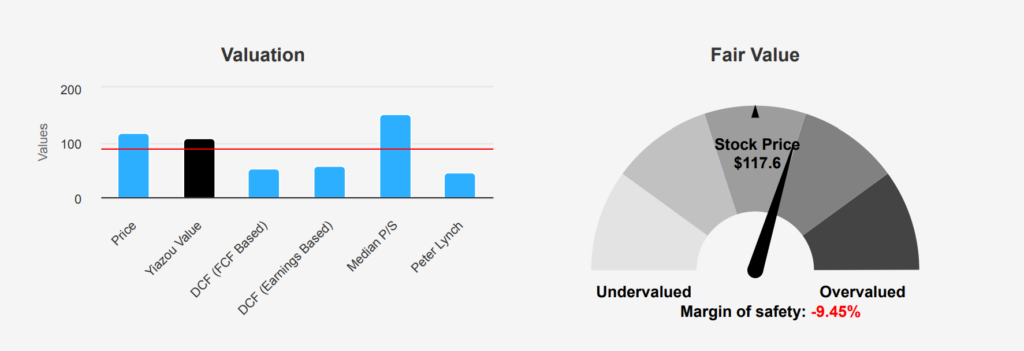
Disney’s current valuation metrics indicate a mixed picture. The intrinsic value stands at $107.44, while the current market price is $117.60, resulting in a negative margin of safety of -9.46%. This suggests that DIS is currently holds overvaluation relative to its intrinsic worth. The TTM P/E ratio at 43.39 is significantly above the 10-year median of 22.15, indicating potential overvaluation, while the forward P/E ratio of 21.69 aligns more closely with historical norms, hinting at market expectations for improved future earnings and DIS dividend.
The EV/EBITDA ratio of 17.21 exceeds the 10-year median of 15.12 but remains well below the historical high, suggesting that while the stock is somewhat expensive, it isn’t at extreme levels compared to past valuations. The P/B ratio of 2.11 is below its 10-year median of 3.33, indicating a potential undervaluation relative to book value, though this may reflect broader sector weaknesses. The TTM Price-to-Free-CashFlow is slightly lower than its historical median, suggesting that cash flow generation is relatively valued as per historical standards.
Analyst sentiment appears cautiously optimistic, with the current price target of $122.52 reflecting slight upside potential from the current price. However, given the intrinsic value discrepancy, investors should be cautious of the current pricing, especially considering the lack of a margin of safety. The stock might be appealing for those anticipating strong future performance or strategic improvements, but it poses risks for value-focused investors seeking a discount on intrinsic value.

Gross Margin Decline and Insider Selling: Balancing Risks and Financial Strengths
Disney stock presents a mixed risk profile. The company’s gross margin has been in a long-term decline, with an annual decrease of 1.2%, signaling potential challenges in maintaining cost efficiency. Insider selling off 380,210 shares without corresponding buying activity over the past three months could indicate decreased confidence among top executives. Additionally, the stock’s price and price-to-sales ratio are near two-year highs, suggesting that it may be overvalued, while the revenue growth per share has slowed down over the past year, potentially limiting future upside and growth for DIS dividend.
On the positive side, the operating margin is expanding, enhancing profitability if sustained. Disney’s Piotroski F-Score of 8 reflects strong financial health and operational efficiency, and the Beneish M-Score indicates a low likelihood of accounting manipulation. However, the Altman Z-score of 2.31 places Disney in the grey area for financial stress, necessitating careful monitoring. Furthermore, the company’s return on invested capital is lower than its weighted average cost of capital questions capital efficiency. Investors should weigh these factors, considering both operational strengths and financial risks, before making investment decisions.
Disney Insiders’ Cautious Selling Amid Institutional Stability
The insider trading activity for The Walt Disney Company over the past year reveals a tendency towards selling. In the last three months, there have been three insider sales and no buys, indicating a potential lack of confidence among the company’s directors and management in short-term stock performance. Over six months, the data shows one insider purchase against three sales, maintaining a selling trend. This pattern persisted over the past year, with three buys compared to eight sales.
Insider ownership stands at a modest 0.97%, suggesting that company insiders have limited direct investment in the firm, which could impact their motivation to influence stock performance positively. In contrast, institutional ownership is significantly higher at 70.81%, indicating that institutional investors have a substantial stake in the company, potentially providing stability through professional management and oversight.
Overall, the trend suggests cautiousness from insiders, possibly reflecting concerns about the company’s near-term challenges or a belief that the stock is fairly valued or overvalued at current levels.

Decreased Trading Volume and 25.21% Dark Pool Activity: What it Signals For DIS Dividends
The liquidity and trading analysis for Disney highlights several key metrics. The current trading volume for DIS is approximately 8,017,233 shares per day, which is below its two-month average daily trading volume of 10,011,428 shares. This indicates a recent decrease in trading activity, which could suggest lower investor interest or less market volatility around the stock at present.
In terms of liquidity, the Dark Pool Index (DPI) stands at 25.21%. The DPI measures the proportion of trades executed on private exchanges that are not visible to the public and can be used to gauge institutional trading activity. A DPI of 25.21% suggests that a significant portion of DIS trades are occurring in dark pools, which may indicate a strong presence of institutional investors and potentially less impact on public market prices from large trades.
Overall, the volume and DPI metrics suggest that while there is a decrease in public trading activity, there remains substantial interest and activity in less transparent trading venues. This can be interpreted as steady institutional interest but may also reflect strategic trading to avoid market impact.
Disney Trades by Congress: Political Insights on Portfolio Moves
In reviewing recent financial disclosures, there were two notable trades involving Disney by members of Congress. On October 29, 2024, Senator Sheldon Whitehouse, a Democrat from the Senate, executed a full sale of Disney stock valued between $1,001 and $15,000. This transaction was reported on November 7, 2024. Earlier, on September 4, 2024, Representative John James, a Republican from the House of Representatives, also sold Disney shares within the same value range. His report was filed on September 6, 2024.
The coinciding sales by members from both political parties might indicate a perceived downturn in Disney’s performance or a strategic reallocation of portfolios. Given Disney’s market influence, these transactions may reflect broader market sentiments. Monitoring Disney’s stock performance and any associated market news during this period could provide further insights into the motivations behind these sales.
Disclosures:
Yiannis Zourmpanos has a beneficial long position in the shares of DIS either through stock ownership, options, or other derivatives. This report has been generated by our stock research platform, Yiazou IQ, and is for educational purposes only. It does not constitute financial advice or recommendations.


