CVS Stock: Investment In Comprehensive Healthcare Services
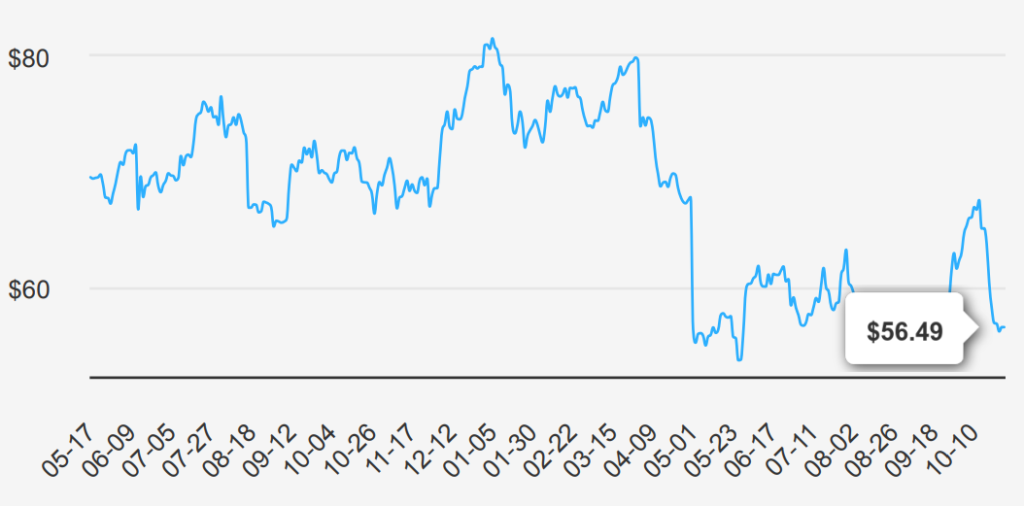
CVS Health offers a diverse set of healthcare services. Its roots are in its retail pharmacy operations, where it operates over 9,000 stores, primarily in the US. CVS is also a large pharmacy benefit manager (through Caremark), processing about 2 billion adjusted claims annually. It also operates a top-tier health insurer (acquired through Aetna) that serves about 26 million medical members. The company’s recent acquisition of Oak Street adds primary care services to the mix, which could have significant synergies with all its existing business lines. CVS stock is currently trading at ~$56.5

Earnings Performance: EPS Trends and Revenue Growth Insights
CVS reported an EPS without NRI (excluding non-recurring items) of $1.41 for Q2 2024, showing a slight improvement from $1.31 in Q1 2024. However, it reflects a decline from $1.767 in Q2 2023, indicating challenges compared to last year. The EPS (Diluted) for the current quarter was $1.41, up from $0.88 in Q1 but down from $1.48 year-over-year. Revenue per share increased to $72.465 from $69.8 in Q1 2024, suggesting revenue growth momentum. CVS has demonstrated a solid 5-year CAGR of 6.00% and a 10-year CAGR of 4.70% in annual EPS without NRI.
The gross margin for CVS stands at 14.70%, the lowest in the past decade, compared to the 10-year median of 17.11% and a high of 18.25%. This margin compression could be indicative of increased costs or pricing pressures. The company has been actively managing its share count, with a recent 1-year buyback ratio of 2.00%, meaning CVS repurchased 2.00% of its outstanding shares over the year. This contrasts with a negative 2.00% over the last decade, highlighting a shift towards more aggressive capital return strategies, positively impacting EPS by reducing the number of shares outstanding.
Looking ahead, analysts forecast CVS’s revenue to reach $408.7 billion by 2026, with EPS estimates of $4.579 for FY1 ending and $5.704 for FY2. This suggests a potential recovery and growth trajectory. The healthcare industry’s growth may be around 5% annually over the next decade. CVS’s next earnings announcement is on November 6, 2024, which will provide further insights into its financial health and alignment with CVS stock forecast.

CVS Stock’s ROIC vs. WACC: Historical Performance Analysis
CVS’s financial performance, particularly its capital allocation efficiency, here is an examination of its Return on Invested Capital (ROIC) in relation to its Weighted Average Cost of Capital (WACC). The 5-year median ROIC is 6.11%, while the 5-year median WACC is 4.70%. This suggests that CVS has historically created economic value since the ROIC exceeds the WACC, indicating efficient use of capital.
Currently, CVS has an ROIC of 4.84%, which is slightly above the current WACC of 4.50%. This marginal spread still signifies value generation, albeit less pronounced than historical figures. Over a 10-year period, the ROIC has fluctuated, reaching a high of 11.51% and a low of -3.80%, yet it has generally remained above the WACC’s median of 5.57%.
Overall, CVS’s ability to maintain an ROIC above its WACC reflects positive value creation, indicating effective management in leveraging its capital to generate shareholder value. However, recent figures suggest a narrowing margin that should be monitored under the CVS stock forecast.

CVS Health: Steady Dividend Growth and Financial Risks
CVS Health’s recent dividend performance shows a steady growth trajectory. Over the past five years, the dividend growth rate was 3.60%, with a more robust 6.60% increase in the past three years. This reflects a commitment to returning value to shareholders, albeit at a moderate pace compared to some peers in the healthcare sector.

The forward dividend yield stands at 4.70%, at the high end of its 10-year range, indicating a potentially attractive income for investors. However, the high Debt-to-EBITDA ratio of 4.92 is a concern, suggesting high financial risk and potential challenges in debt servicing especially if it exceeds the threshold (where caution is advised).
The company maintains a comfortable dividend payout ratio of 39.0%, well below its historical highs, which provides some buffer for maintaining dividend payments even if earnings fluctuate.
Looking ahead, the estimated 3-5 year dividend growth rate of 4.56% suggests continued, albeit modest, increases. As for the next ex-dividend date, with a quarterly frequency, the following ex-dividend date after October 21, 2024, should be January 19, 2025, considering weekends and holidays.

CVS Stock’s Valuation Metrics Indicate Strong Investment Opportunity
Under CVS stock forecast, the current market valuation reveals significant potential for investors seeking a margin of safety. With an intrinsic value estimated at $103.87, compared to its current market price of $56.12, there is a considerable margin of safety of 45.97%. This suggests a substantial undervaluation, offering investors a buffer against potential market fluctuations. The stock’s Forward Price-to-Earnings (P/E) ratio of 7.7 is notably below its 10-year median of 16.40, reinforcing the perspective of undervaluation. Furthermore, the TTM P/S ratio stands at 0.2, which is equal to its 10-year low, indicating a potential opportunity for value investors.
Analyzing CVS’s TTM EV/EBITDA ratio of 8.17, which is closer to its 10-year low of 7.25 than the median of 10.89, supports the undervaluation narrative. Moreover, the TTM Price-to-Book (P/B) ratio is at its 10-year low of 0.94, suggesting CVS is trading below its historical book value range. The TTM Price-to-Free-Cash-Flow ratio of 13.37, though above its 10-year median, still presents a reasonable valuation, especially given the substantial free cash flow that CVS generates.
From an outlook perspective, analyst ratings portray a moderate consensus with a price target of $67.39, indicating upside potential from the current price. The consistency in price targets over recent months underscores stable expectations for CVS. Given these metrics, CVS’s current valuation implies a solid opportunity for investors.

Balancing Act: Financial Challenges vs. Recovery Potential
CVS Health Corp is experiencing several financial challenges, as indicated by its declining gross margin at an average rate of -1.4% per year and a similar trend in its operating margin, which has decreased by 3% annually over the past five years. The company’s Altman Z-score of 2.14 places it in the “grey area,” suggesting potential financial stress that could imply a risk of future financial difficulties if not addressed.
However, CVS Health Corp also presents several positive indicators that may mitigate these risks. The Piotroski F-Score of 7 suggests a strong financial position, while the Beneish M-Score of -2.25 indicates a low likelihood of earnings manipulation. Additionally, the stock’s valuation metrics, such as the price-to-book (PB) ratio of 0.95, price-to-earnings (PE) ratio of 10.1, and price-to-sales (PS) ratio of 0.2, are near their 10-year lows, suggesting potential undervaluation. Furthermore, a high dividend yield close to its 10-year peak may appeal to income-focused investors.
Overall, while CVS faces certain operational challenges, its strong financial health indicators and attractive valuation metrics suggest the potential for recovery and growth, assuming management effectively addresses underlying issues.
CVS Insider Activity: Modest Trades, Positive Sentiment
Over the past 12 months, insider trading activity at CVS has been relatively modest. Within this period, there have been three insider purchases and only one insider sale, indicating a net positive insider sentiment. In the most recent six months, there have been two purchases and no sales, suggesting confidence in the company’s potential among its directors and management.
Despite the low volume of insider trades, the consistent buying over the longer term could be interpreted as a sign of optimism about the company’s future performance. This trend is further supported by the high institutional ownership of 81.57%, which suggests strong confidence from professional investors in CVS’s prospects.
Insider ownership stands at a modest 0.43%, indicating that while insiders hold some interest in the company, their stake is relatively small compared to institutional investors. Overall, the CVS stock forecast reflects a stable insider trading environment with a slight positive bias, potentially signaling opportunities for long-term growth.

CVS Stock Liquidity Analysis: Trading Volume Trends and Dark Pool Activity
CVS Health Corporation (CVS) shows a daily trading volume of 8,749,681 shares, which is below its average daily trading volume of 11,089,959 shares over the past two months. This indicates a recent decrease in trading activity, possibly due to lower investor interest or market conditions.
The liquidity of CVS appears to be robust, given its relatively high average trading volume, allowing for efficient buying and selling of shares without significant price impact. However, the recent drop in volume might imply reduced liquidity in the short term, potentially leading to wider bid-ask spreads.
The Dark Pool Indexes (DPI) percentages provide insight into off-exchange trading activity. With a DPI of 36.2% for the day, 37.0% for the week, and 37.1% for the month, a consistent level of dark pool trading is evident. This suggests that a significant portion of trades is executed away from public exchanges, which might influence price discovery and indicate institutional trading interest.
Overall, the company maintains a solid liquidity profile under the CVS stock forecast, but the lower recent trading volume warrants monitoring. The consistent DPI levels suggest ongoing engagement from institutional investors, which could affect future trading dynamics and liquidity.
CVS Government Contracts: Volatile Growth and Future Forecast
CVS’s involvement in government contracts has shown significant volatility over recent years. The company saw substantial growth from 2019 to 2020, with a dramatic leap in contract value from $230,630 to over $39 million. This trend continued, peaking in 2022 with over $355 million. However, 2023 saw a notable decline to approximately $130 million, suggesting a potential shift in government priorities or contract renewals. CVS stock forecast for 2024 indicates a further decrease, suggesting strategic reassessment may be necessary.
Congressional CVS Stock Transactions
Two notable transactions occurred in recent congressional trades involving CVS stock. On August 26, 2024, Senator Tommy Tuberville, a Republican, reported a full sale of CVS shares valued between $1,001 and $15,000. This transaction was documented on September 13, 2024, indicating a strategic divestment from the healthcare company.
Earlier, on June 27, 2024, Representative Earl Blumenauer, a Democrat, also sold CVS shares within the same value range of $1,001 to $15,000. This sale was reported on July 6, 2024. These transactions from both a senator and a representative across party lines suggest a potential bipartisan concern or strategy regarding CVS stock during this period.
Analyzing these trades provides insights into broader trends or concerns within the healthcare sector or reflects individual portfolio adjustments in response to market conditions or legislative developments affecting CVS stock forecast.
Disclosures:
Yiannis Zourmpanos has a beneficial long position in the shares of CVS either through stock ownership, options, or other derivatives. This report has been generated by our stock research platform, Yiazou IQ, and is for educational purposes only. It does not constitute financial advice or recommendations.


