CVS Stock: Invest In Diversified Business Model and Expansion Potential
CVS Health (CVS) offers a diverse set of healthcare services. Its roots are in its retail pharmacy operations, where it operates over 9K stores primarily in the us. CVS is also a large pharmacy benefit manager (acquired through Caremark), processing about 2 billion adjusted claims annually. It also operates a top-tier health insurer (acquired through Aetna) that serves about 26 million medical members. The company’s recent acquisition of Oak Street adds primary care services to the mix, which could have significant synergies with all its existing business lines. The stock is trading near $52. Discover more on CVS stock forecast 2025 in following sections.

CVS’s Recent EPS Decline and Future Revenue Projections
CVS Health reported its Q3 2024 earnings with an EPS without NRI (excluding non-recurring items) of $1.09, a decline from $1.41 in Q2 2024 and $1.756 in Q3 2023. This decrease indicates a challenging quarter compared to both the previous quarter (QoQ) and the same quarter last year (YoY). The 5-year CAGR for annual EPS without NRI stands at 6.00%, while the 10-year CAGR is slightly lower at 4.70%, reflecting steady long-term growth despite recent quarterly fluctuations. Revenue per share for Q3 2024 was $75.797, marking an increase from $72.465 in Q2 2024 and from $69.584 in Q3 2023, showing resilience in revenue generation.
The company’s gross margin for the quarter was at its 10-year low of 14.20%, compared to the 5-year median of 17.73%. This margin compression suggests increased cost pressures or pricing challenges. CVS has engaged in share repurchase activities, with a 1-year buyback ratio of 2.30%, indicating that 2.30% of outstanding shares were repurchased over the past year. However, the 10-year buyback ratio is negative at -2.00%, suggesting a net issuance of shares over the decade, potentially diluting the EPS impacts of recent buybacks.
Looking ahead, analysts forecast revenues of $371.903 billion for 2024, rising to $406.967 billion by 2026, implying steady growth. The estimated EPS for the fiscal year ending 2025 is 4.665. The next earnings report is due on February 12, 2025, which will provide further insights into the company’s trajectory under CVS stock forecast 2025. The healthcare industry may grow at a steady pace over the next decade, offering CVS opportunities for expansion and increased market share.

ROIC vs. WACC – A Value Creation Challenge
CVS Health’s financial performance and capital allocation strategy can be evaluated by examining its Return on Invested Capital (ROIC) relative to its Weighted Average Cost of Capital (WACC). Over the past five years, CVS’s median ROIC stands at 6.11%, which surpasses its median WACC of 4.70%. This indicates that CVS has been effectively generating economic value, as its ROIC exceeds the cost of capital, suggesting efficient use of its invested capital.
In the context of recent figures, CVS’s ROIC is 4.15%, which is slightly lower than its WACC of 4.76%. This implies a potential short-term challenge in value creation, as the returns do not cover the cost of capital. However, considering historical data with a 10-year median ROIC of 6.50%, CVS has a track record of generating positive economic value. Overall, while CVS has shown the ability to create value over time, recent performance indicates a need for strategic improvements to ensure its ROIC consistently surpasses its WACC, maintaining value creation for shareholders under CVS stock forecast 2025.

High Yield Amid Modest Growth and Leverage Risks
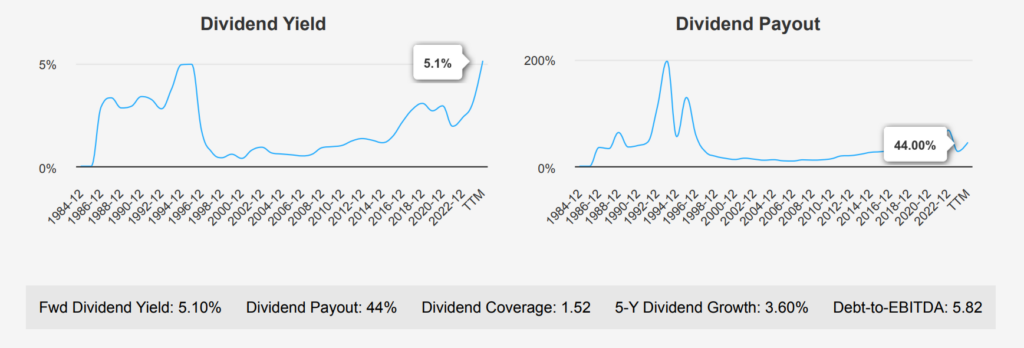
In the recent quarter, CVS has maintained a steady dividend per share (DPS) of $0.665, reflecting a consistent payout strategy. The company’s 5-year dividend growth rate stands at 3.60%, with a slightly higher 3-year growth rate at 6.60%, indicating a relatively stable dividend increase over recent years. Comparatively, the forward dividend yield of 5.10% is attractive against the sector’s historical median yield of 2.65%.

However, the Debt-to-EBITDA ratio of 5.82 is notably high, suggesting elevated financial risk, as it exceeds the 4.0 threshold generally considered as indicating high risk. This level of leverage could potentially impact future dividend policies if not managed carefully. The forecasted 3-5 year dividend growth rate is at 3.58%, aligning closely with past growth rates, signaling modest but steady increases.
Regarding the ex-dividend date, the next one is on January 23, 2025. Given the quarterly frequency of dividends, the subsequent ex-dividend date would be around April 23, 2025, assuming it falls on a weekday. CVS’s dividend payout ratio remains at 44.0%, which is well-managed compared to its historical highs, allowing room for future increases despite the high leverage.

CVS Stock: 40% Margin of Safety and Undervaluation Indicators
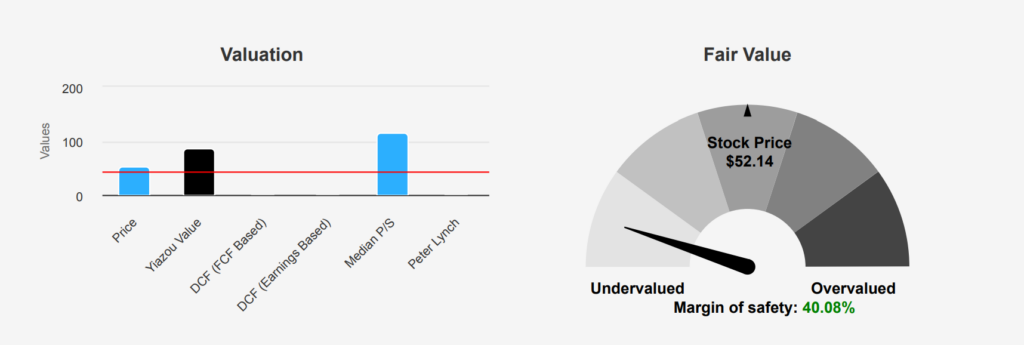
CVS’s intrinsic value is at $87.02, with the current market price at $52.14, indicating a significant margin of safety of 40.08%. This suggests the stock holds undervaluation against its intrinsic worth, providing a potential buying opportunity. The Forward P/E ratio stands at 8.55, lower than the TTM P/E of 13.23, which is below the 10-year median of 16.17. This implies expected earnings growth and suggests the stock is trading at an attractive price against historical averages. The TTM Price-to-Sales ratio is at a low of 0.18, close to its 10-year low of 0.15, indicating the stock may hold undervaluation in terms of sales.
The TTM EV/EBITDA ratio is 9.72, slightly below the 10-year median of 10.76, suggesting that CVS currently holds a fair value in terms of operational cash flow generation relative to its enterprise value. However, the TTM Price-to-Free-Cash-Flow ratio is 37.42, significantly above its 10-year median of 9.21, indicating potential overvaluation in terms of cash flow. The TTM Price-to-Book ratio is 0.88, below the 10-year median of 1.65, suggesting the stock holds undervaluation relative to its book value.
Analyst ratings and price targets show a slight downward trend over recent months, with the latest target at $63.74, still above the current price. This suggests a positive outlook yet indicates cautious optimism among analysts. Overall, CVS appears undervalued based on intrinsic value and several key valuation metrics under CVS stock forecast 2025, offering a potential margin of safety for investors seeking value stocks in the healthcare sector.

Declining Margins and Financial Pressures
CVS Health Corp is experiencing several financial challenges. The long-term decline in gross margin, averaging a decrease of 1.4% per year, and a 3% annual decline in operating margin over the past five years suggest shrinking profitability. These metrics indicate increasing cost pressure or competitive pricing strategies are not adequately offset by revenue growth. Furthermore, the company’s return on invested capital is lower than its weighted average cost of capital, suggesting that CVS is not efficiently using its capital to generate returns, posing a risk of underperformance relative to its cost of capital.
Additionally, the Altman Z-score of 2.07 places CVS in the “grey area,” signaling potential financial stress. While this score is above the critical threshold of 1.8, indicating immediate bankruptcy risk is not a concern, it does highlight the need for careful monitoring of financial health. On the positive side, the Beneish M-Score of -2.25, which is well below the threshold of -1.78, suggests the company is unlikely to be engaging in earnings manipulation, which provides some reassurance regarding the integrity of its financial statements. Overall, while CVS remains stable for now, these factors warrant close attention to its financial strategies and operational efficiencies.
Low Insider Ownership, High Institutional Confidence
The insider trading activity for CVS over the past year reflects a limited amount of transactions by the company’s directors and management. In the last 12 months, there were two insider purchases and one insider sale, with no activity recorded in the most recent 6-month and 3-month periods. This minimal level of trading suggests a cautious approach from insiders, potentially indicating a stable outlook or a lack of significant market-moving information.
Insider ownership stands at 0.44%, which is relatively low, suggesting that the company’s executives and directors do not hold a substantial portion of the company’s shares. This level of ownership might not strongly align their interests with those of shareholders. On the other hand, institutional ownership is considerably high at 88.71%, indicating strong interest and confidence from institutional investors, which can be a positive signal for the company’s stability and market perception.
Overall, the lack of recent insider trading activity and the high institutional ownership suggest a stable, but not overly aggressive, insider sentiment towards CVS.

Decreasing Volume and Dark Pool Activity Trends
CVS Health Corporation has a daily trading volume of 10,375,525 shares, below its two-month average daily trade volume of 14,279,120 shares, indicating a decreasing trend in trading activity. This lower trading volume may suggest reduced investor interest or less market volatility compared to previous months.
The current DPI is 38%, indicating that a significant portion of CVS’s trading volume is occurring in dark pools, where trades are private rather than on public exchanges. A DPI of 38% can suggest that institutional investors are actively trading the stock, potentially influencing market dynamics without immediate visibility to retail investors.
Under CVS stock forecast 2025, liquidity analysis reveals that CVS’s trading volume provides a reasonable level of liquidity, although the decline compared to its average could mean less ease in executing large trades without impacting the stock price. Investors should monitor whether this trend continues, as sustained lower volumes might affect pricing efficiency and market sentiment.
Overall, while CVS maintains a robust liquidity profile given its large market presence, the current trading activity reflects a potential shift in market behavior that could influence short-term price movements and investment strategies.
Recent CVS Stock Sales Reflect Broader Market Trends
In recent congressional trading activity, Representative Thomas R. Suozzi, a Democrat from the House of Representatives, reported a sale of CVS stock. This transaction occurred on October 24, 2024, with a value range of $1,001 to $15,000, and was reported on November 12, 2024. This transaction may indicate a strategic financial decision or a response to market conditions affecting CVS stock during that period.
Similarly, Senator Tommy Tuberville, a Republican, also reported a full sale of CVS shares. This transaction took place on August 26, 2024, and was reported on September 13, 2024. The sale falls within the same value range of $1,001 to $15,000. The timing of both sales in close succession might reflect broader market trends or specific developments within CVS that led these legislators to divest their holdings in the company.
Disclosures:
Yiannis Zourmpanos has a beneficial long position in the shares of CVS either through stock ownership, options, or other derivatives. This report has been generated by our stock research platform, Yiazou IQ, and is for educational purposes only. It does not constitute financial advice or recommendations.


