Alphabet Shares: Invest In Diverse Revenue Streams Driving Stability
Alphabet (GOOG) is a holding company that wholly owns internet giant Google. The California-based company derives slightly less than 90% of its revenue from Google services, the vast majority of which is advertising sales. Alongside online ads, Google services houses sales stemming from Google’s subscription services (YouTube TV, YouTube Music, among others), platforms (sales and
in-app purchases on Play Store), and devices (Chromebooks, Pixel smartphones, and smart home products such as Chromecast). Google’s cloud computing platform, or GCP, accounts for roughly 10% of Alphabet’s revenue, with the firm’s investments in up-and-coming technologies such as self-driving cars (Waymo), health (Verily), and internet access (Google Fiber) making up the rest. Alphabet shares are trading near $173.

Strong EPS Growth and Buyback Strategy Underpin Strength
For the latest quarter ending September 30, 2024, Alphabet reported an EPS without non-recurring items (NRI) of $1.986, showing an increase from $1.972 in the previous quarter (QoQ) and $1.636 from the same period last year (YoY). The EPS (Diluted) was $2.12, up from $1.89 in the previous quarter.
Revenue per share rose to $7.107 from $6.782 in Q2 2024. Over the past five years, the EPS without NRI has had a Compound Annual Growth Rate (CAGR) of 25.90%, while the 10-year CAGR stands at 21.80%, highlighting robust growth over the periods. The gross margin for the quarter was 57.85%, slightly above the 5-year median of 55.58%, suggesting stable and efficient cost management. Alphabet continues its share buyback strategy with a 1-year buyback ratio of 2.20%. This indicates that 2.20% of its outstanding shares were repurchased. This can positively impact the EPS by reducing the number of shares outstanding. Over the past decade, the buyback ratio has averaged around 0.70%, with significant variations reflecting a flexible approach to capital allocation.
Looking ahead, analysts forecast revenue growth from $350,022 million in 2024 to $431,285 million by 2026, suggesting a solid upward trend. The estimated EPS for FY1 ending 2025 is $7.970, rising to $8.934 for FY2. The next earnings release will be January 30, 2025. Industry growth may be ~10% annually over the next decade, which supports Alphabet’s potential for continued expansion and market leadership.

ROIC vs. WACC: Alphabet’s Consistent Value Creation
GOOG’s financial performance demonstrates strong economic value creation through its Return on Invested Capital (ROIC), significantly surpassing its Weighted Average Cost of Capital (WACC). With a current ROIC of 32.52% and a WACC of 10.38%, GOOG is effectively generating substantial value for its shareholders. This indicates that the company can earn returns well above the cost of capital required to fund its operations, highlighting efficient capital allocation and operational excellence.
Historically, GOOG’s ROIC has remained robust, with a 5-year median of 29.25% and a 10-year high of 35.53%. These figures further reinforce the company’s ability to consistently generate returns that exceed its capital costs. In contrast, the company’s WACC has maintained a relatively stable range, with a 5-year median of 8.01% and a 10-year median of 7.75%, underscoring a favorable cost of capital environment. Overall, GOOG’s ability to sustain a high ROIC relative to its WACC exemplifies its strong financial efficiency and capacity to create economic value over time.

Low Yield Strategy Reflecting Conservative Capital Allocation
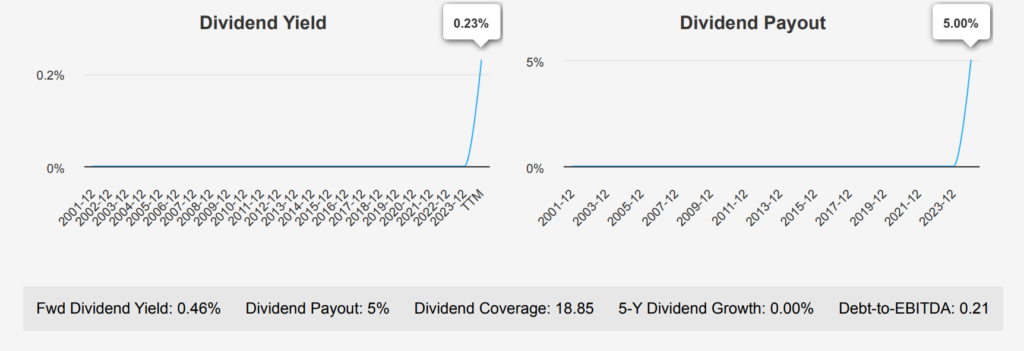
Alphabet continues to maintain a stable dividend strategy. This reflects a conservative approach to dividend distribution, possibly focusing on reinvestment or other strategic initiatives. Currently, the company offers a forward dividend yield of 0.46%, which is modest, especially when compared to historical yields in its sector. GOOG’s debt-to-EBITDA ratio stands at 0.21, indicating a very low level of financial risk and robust capacity to meet its debt obligations. This favorable low leverage ratio suggests that the company maintains a healthy balance sheet consistent with Google’s reputation for financial prudence.

Despite a dividend payout ratio of 5.0%, the historical trends suggest that dividends were not a
focus in earlier years, and the current payout policy is a recent development. The next ex-dividend date is set for December 9, 2024, and given the quarterly frequency, the following ex-dividend date would likely be March 7, 2025, ensuring it falls on a future weekday.

Signs of Potential Overvaluation Amid Price Target Increases
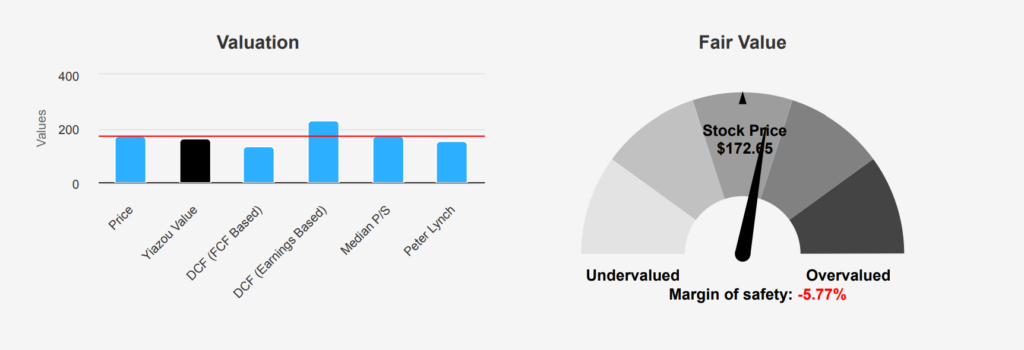
The intrinsic value of Alphabet shares stands at $163.22, compared to the current market price of $172.65, resulting in a negative margin of safety of -5.78%. This suggests the stock trades above its estimated intrinsic value, indicating potential overvaluation. The current Forward P/E ratio is 19.36, which falls closer to its 10-year low of 17.20, suggesting a relatively reasonable valuation in terms of expected earnings. However, the TTM P/E ratio of 22.72 is below the 10-year median of 28.68, indicating potential undervaluation on a historical basis.
Meanwhile, the TTM EV/EBITDA ratio is 16.09, slightly below the 10-year median of 17.30, which could suggest the stock is at a fair valuation in terms of enterprise value. Analyzing GOOG’s TTM Price-to-Free-Cash-Flow ratio of 39.11, it is higher than the 10-year median of 29.71. This indicates that Alphabet shares might be overvalued in terms of free cash flow. The TTM Price-to-Book ratio of 6.69 is significantly above its 10-year median of 4.75, which might imply overvaluation from a book value perspective. The TTM P/S ratio is 6.4, aligning closely with its 10-year median of 6.33, suggesting that sales valuation aligns with historical norms.
GOOG’s price target has been trending upwards at $209.27, with a consistent increase observed over the past three months. Analyst ratings remain favorable, with many analysts following the stock. Despite the slight overvaluation indicated by some metrics, the positive analyst outlook and increasing price targets suggest a potential for future appreciation, although investors should remain
cautious due to the negative margin of safety and certain valuation metrics indicating overvaluation.

Evaluating Alphabet’s Financial Health and Insider Trading Trends
Alphabet presents a generally positive financial outlook, reflected by its strong Piotroski F-Score of 8, indicating robust financial health. The Altman Z-score of 13.5 further underscores its stability, suggesting minimal risk of financial distress. The company’s M-score of -2.37 indicates it is unlikely to be manipulating earnings, enhancing trust in its financial statements. Additionally, Alphabet’s
operating margin expansion is a positive indicator of efficient cost management and potential profitability growth.
Despite these strengths, insider selling activity over the past three months raises a cautionary flag, with 19 insider sales totaling 239,244 shares and no insider buying. While insider sales can occur for various reasons and do not necessarily indicate a lack of confidence in the company, investors should consider this trend within the broader context of the company’s financial performance and market conditions. Alphabet’s price-to-earnings (PE) ratio, currently at 22.72, remains near its 1-year low of 21.65, suggesting Alphabet shares might be reasonably valued. The company’s strong interest coverage and cash reserves imply a stable position to manage debt obligations, bolstering investor confidence in its financial resilience.
Overall, while insider activity warrants monitoring, Alphabet Inc’s financial metrics generally reflect a
sound investment profile.
Insider Sales and Ownership Trends at Alphabet
An analysis of insider trading for GOOG over the past year reveals a notable trend of selling activity among directors and management. Over the last 12 months, there have been 43 insider sell transactions and no buy transactions, indicating a consistent pattern of insiders offloading shares. This trend suggests that insiders may perceive Alphabet shares as overvalued or are capitalizing on gains, although the motivations can vary. In the past 6 months, there were 6 sell transactions, but no buys, continuing this divestment trend.
Insider ownership at 3.07% suggests a moderate level of investment in the company by those in leadership positions, while institutional ownership stands at 27.62%, indicating strong confidence from institutional investors. Although insider selling could be interpreted as a lack of confidence, other factors, such as personal financial needs or diversification strategies, must be considered. Overall, the absence of insider buying and consistent selling may warrant further investigation for potential investors.

GOOG Stock: High Trading Volume and Market Liquidity
As of the latest analysis, the liquidity and trading activity of GOOG stock indicates a robust market presence. The stock’s current daily trading volume stands at 21,385,280 shares, which surpasses its two-month average daily trade volume of 18,006,615 shares by approximately 18.8%. This uptick in volume suggests heightened investor interest or increased volatility, potentially driven by recent news or
market events affecting the tech sector.
In terms of liquidity, GOOG exhibits strong availability in the market, facilitating efficient trade execution with minimal price impact. The dark pool index (DPI) at 45% implies that a significant portion of trades are off-exchange, possibly suggesting strategic transactions by institutional investors or efforts to minimize market impact.
Overall, GOOG’s liquidity conditions are favorable for both retail and institutional investors, providing confidence in the ability to transact shares swiftly. The elevated trading volume, compared to its average, highlights active market participation, which could influence short-term price movements. Investors should remain attentive to broader market trends and company-specific developments that might further affect trading dynamics.
Congressional Trades: Diverging Perspectives on Alphabet Stock
In September 2024, two notable trades involving Google were reported by members of the U.S. House of Representatives. On September 20, Representative Marjorie Taylor Greene, a Republican, purchased shares valued between $1,001 and $15,000. This transaction was reported on September 23, 2024. Just days prior, on September 16, Representative Josh Gottheimer, a Democrat, sold shares of the
same company within the same value range on October 3, 2024. The close timing of these transactions by representatives from opposing parties could indicate differing perspectives on Google’s market prospects or personal financial strategies.
Representative Greene’s purchase might suggest confidence in Google’s potential growth, whereas Representative Gottheimer’s sale could reflect a belief that Alphabet shares had reached a peak or a need to reallocate his portfolio. These trades highlight lawmakers’ diverse approaches to investment, possibly influenced by broader market trends or individual financial strategies.
Disclosures:
On the date of publication, Yiannis Zourmpanos did not hold (either directly or indirectly) any positions in the securities mentioned in this article. This report has been generated by our stock research platform, Yiazou IQ, and is for educational purposes only. It does not constitute financial advice or recommendations.


