Alibaba Stock: Dominating Global Commerce with Diverse Ventures
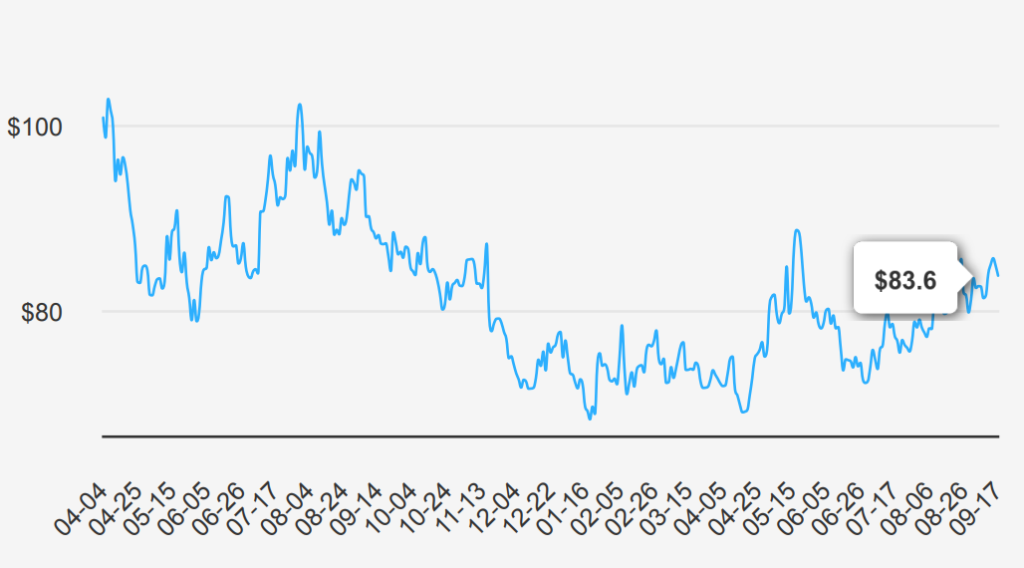
Alibaba (BABA) is the world’s largest online and mobile commerce company, as measured by gross merchandise volume. It operates China’s online marketplaces, including Taobao (consumer-to-consumer) and Tmall (business-to-consumer). The China commerce retail division is the most valuable cash flow-generating business at Alibaba. Additional revenue sources include China commerce wholesale, international commerce retail/wholesale, local consumer services, cloud computing, digital media and entertainment platforms, Cainiao logistics services, and innovation initiatives/other. BABA stock currently trades at ~$84.
Alibaba’s Quarterly Performance: Growth and Buyback
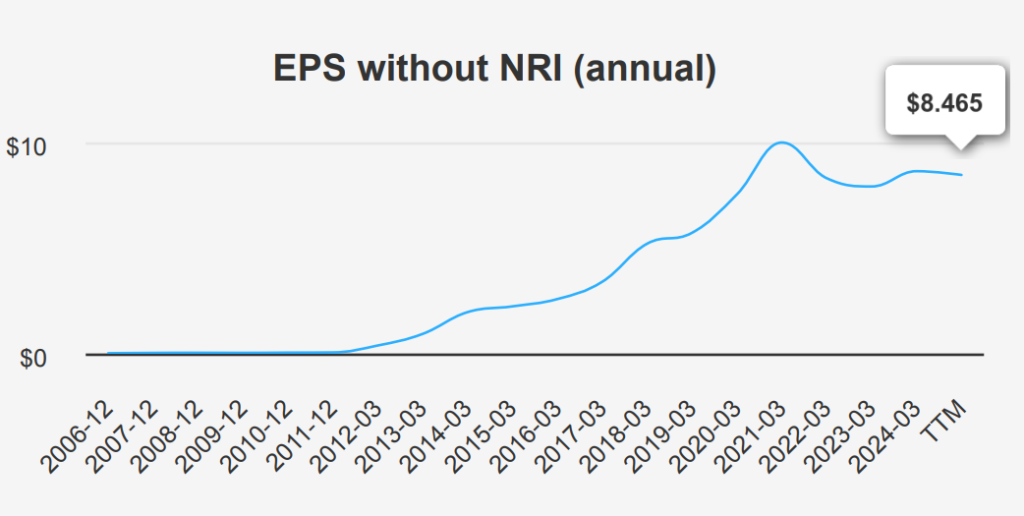
In the latest quarter ending June 30, 2024, Alibaba reported an EPS without non-recurring items (NRI) of $2.261, reflecting a significant improvement from $1.411 in the previous quarter, although slightly below $2.424 from the same period last year. The diluted EPS came in at $1.367, up from $0.178 in the prior quarter but down compared to $1.854 a year ago. Revenue per share increased to $13.688 from $12.335 in the previous quarter, indicating robust growth. The 5-year compound annual growth rate (CAGR) for annual EPS without NRI stands at 6%, while the 10-year CAGR is more impressive at 18.30%.
Alibaba’s gross margin for the quarter was 37.9%, slightly above its 5-year median of 37.7%, yet significantly lower than the 10-year high of 68.72%. The company has actively engaged in share buybacks, with a 1-year buyback ratio of 6.7%, indicating that 6.7% of its outstanding shares were repurchased over the year. This strategy has positively impacted the EPS by reducing the number of shares outstanding, thus enhancing shareholder value. The 10-year buyback ratio stands at -0.4%, reflecting a net increase in shares over the decade.
Looking ahead, analysts forecast revenue growth with estimates reaching $165,972.69 million by 2027, suggesting a promising outlook. The estimated EPS for the next fiscal years ending in FY1 and FY2 are $6.237 and $7.438, respectively. Alibaba’s next earnings release is expected on November 15, 2024, which will provide further insights into its financial trajectory. The industry growth forecast for the next decade remains positive, supporting Alibaba stock’s potential for sustained expansion.
Assessing Alibaba’s ROIC vs. WACC Performance Dynamics
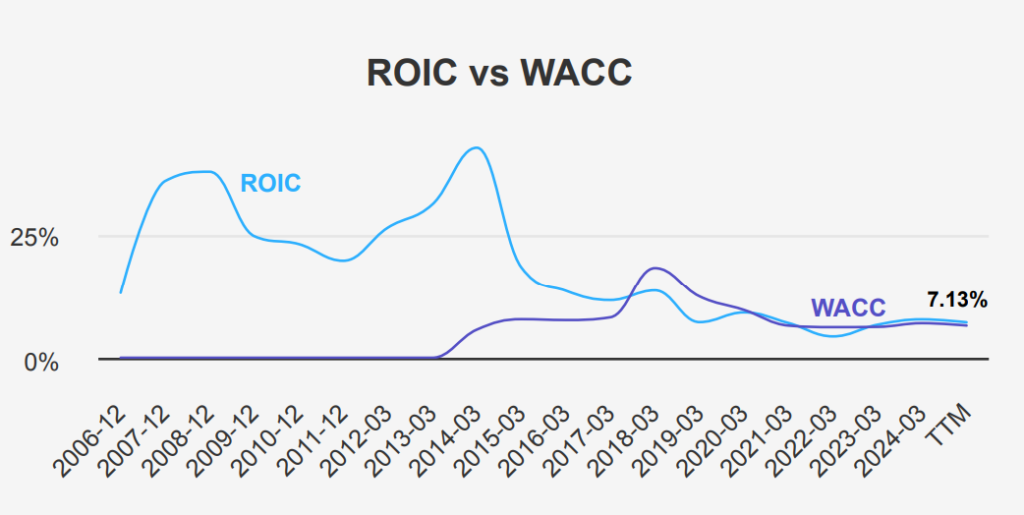
Alibaba’s financial performance can be analyzed by comparing its Return on Invested Capital (ROIC) with its Weighted Average Cost of Capital (WACC). Over the past five years, Alibaba’s median ROIC stands at 6.99%, while its WACC is slightly higher at 6.47%. This indicates that Alibaba is generating positive economic value, as its ROIC exceeds its WACC, albeit marginally.
Furthermore, the latest ROIC value is 7.13%, surpassing the current WACC of 6.48%, reinforcing the notion of value creation. These figures suggest that Alibaba has been able to allocate its capital efficiently, maintaining a slight edge in generating returns over its cost of capital.
However, it’s important to note the narrow margin between ROIC and WACC, which implies limited value creation and highlights the need for Alibaba to enhance its operational efficiency or strategic investments to widen this gap. Overall, while Alibaba is creating value, its financial efficiency could benefit from further improvements to ensure sustainable long-term growth.
Alibaba Stock’s Dividends: Growth Trends and Future Prospects
Its recent quarterly performance continues this trend, reflecting a cautious approach to dividend increases despite a relatively low dividend payout ratio of 24.0%. This conservative payout is significantly lower than its historical highs, indicating room for potential increases without affecting financial stability.
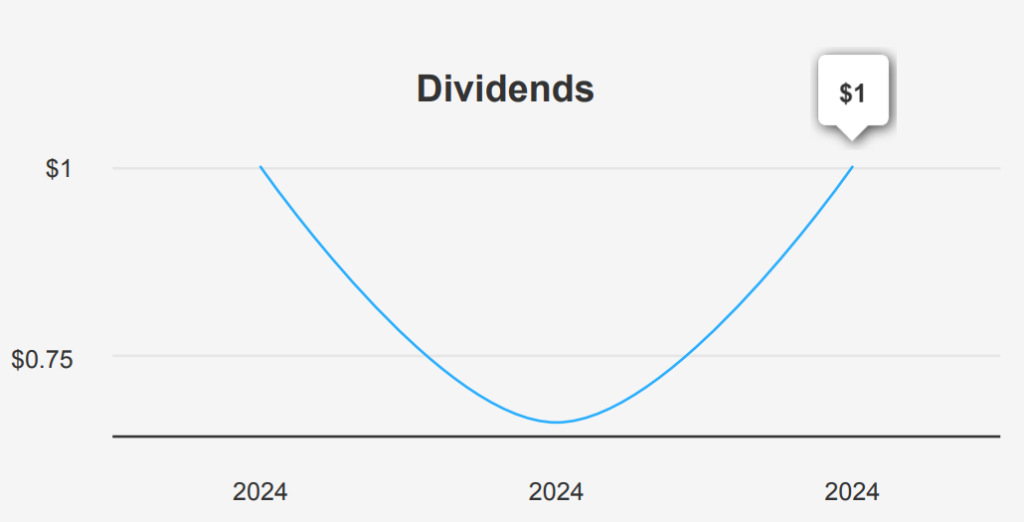
The company’s forward dividend yield stands at 2.38%, which is competitive within its sector, given the historical median yield of 1.38%. This suggests that Alibaba is offering an attractive yield compared to its past performance.
Alibaba’s Debt-to-EBITDA ratio of 1.52 falls below the 2.0 threshold, signaling a strong debt-servicing capability and lower financial risk. This positions the company well for potential dividend increases in the future.
The forecasted 3-5 year dividend growth rate of 9.48% indicates potential for future increases. It suggests investor confidence in sustained earnings and cash flow improvements. The next ex-dividend date is June 13, 2025, for a regular cash dividend and a special dividend, providing investors with ample time to plan their investments. Overall, Alibaba stock has a steady financial strategy with room for dividend growth.

BABA’s Undervaluation: Metrics and Future Prospects
Alibaba Group presents an intriguing investment opportunity, with its intrinsic value estimated at $97.49 compared to the current market price of $83.60. It offers a margin of safety of approximately 14.25%. This suggests that BABA’s stock is potentially undervalued, providing a buffer for investors. The Forward Price-to-Earnings (P/E) ratio is notably low at 9.45. This indicates market expectations of earnings growth, especially when compared to its 10-year median P/E of 30.88. However, the TTM P/E ratio stands at 21.88. This is closer to its historical low and far below its historical high of 114.32. This suggests a significant valuation compression over the past decade.
Examining the TTM EV/EBITDA ratio, currently at 9.72, reveals it is well below the 10-year median of 21.44. This points to a potentially undervalued status relative to its historical norms. The TTM Price-to-Book (P/B) ratio is 1.54. This is near its historical low of 1.23 and substantially lower than the 10-year median of 5.72. These metrics indicate a possible undervaluation relative to its book value and historical performance, with the TTM Price-to-Free-Cash-Flow ratio at 8.86, further supporting this view. This is significantly below its 10-year median of 20.98.
The analyst consensus remains optimistic, with a price target of approximately $108.23, reflecting confidence in BABA’s future performance. This target has remained relatively stable over the past few months, indicating steady expectations from analysts. When combined with the intrinsic value analysis and current valuation metrics, BABA presents a potential opportunity for investors seeking undervalued growth stocks. A margin of safety and favorable analyst opinions support it.

Navigating Alibaba’s Financial Risks and Rewards
Alibaba’s financial performance presents a mixed-risk landscape. The company’s declining gross margin at a rate of 4.5% annually, coupled with a 5.8% yearly decrease in operating margin over the past five years, signals a weakening profitability. This trend is concerning as it may affect Alibaba’s ability to sustain its competitive position and reinvest in growth. Additionally, the slowdown in revenue growth per share over the last year raises questions about Alibaba’s ability to maintain its market dominance and adapt to evolving consumer demands.
Despite these challenges, Alibaba maintains a relatively strong financial footing, as evidenced by its solid balance sheet strength. Furthermore, the Beneish M-Score of -2.75 suggests that the risk of financial statement manipulation is low. It supports the integrity of its reported financials. However, the Altman Z-score of 2.53 places Alibaba in a “grey area,” indicating some level of financial stress, though not immediate bankruptcy risk. Investors should remain cautious, monitoring Alibaba’s ability to reverse its declining margins and accelerate revenue growth. Meanwhile, one should consider its robust financial health as a mitigating factor for long-term investments.
BABA Stock Insider Activity: Stability or Caution
Insider trading trends for Alibaba stock over the past year are interesting. It is noteworthy that there has been no recorded insider buying or selling activity within the 3, 6, or 12-month periods. This lack of insider transactions suggests a stable view from company directors and management regarding the stock’s current valuation and potential future performance. The insider holdings account for 1.47%.
On the other hand, institutional ownership stands at 18.81%. This reflects a moderate level of confidence from institutional investors, who often conduct rigorous analyses before investing. This institutional ownership level suggests that Institutional investors see potential value in BABA’s future prospects.
Assessing Alibaba’s Liquidity and Trading Dynamics
Alibaba Group Holding Ltd. (BABA) exhibits notable liquidity and trading activity. The current daily trading volume stands at 11,185,131 shares, which is slightly below its two-month average of 13,017,980 shares. This indicates a moderate level of investor interest and liquidity, suggesting that the stock trades actively, although the recent volume is slightly under the average.
The Dark Pool Index (DPI) for BABA is 50.38%, reflecting that approximately half of its trades are executed through private exchanges, away from public stock exchanges. A DPI around this level typically indicates a balanced sentiment among institutional investors, neither overly bullish nor bearish.
Overall, BABA’s trading volumes and liquidity metrics suggest it is a well-traded stock with sufficient liquidity to accommodate large trades without significant price impact. The slightly lower daily volume compared to the average could indicate a temporary reduction in trading activity. However, the balanced DPI suggests stability in institutional trading behavior, providing a steady outlook on BABA’s trading environment.
Alibaba’s Government Contracts: Peaks, Valleys, and Future Prospects
Alibaba has shown a fluctuating trend in securing government contracts over the years. After a peak in 2022 with $1,500,000,000, the contracts witnessed a reduction to $800,000,000 in 2023. This variability might reflect government procurement strategy changes or Alibaba’s business focus shifts. Despite the decrease, Alibaba’s ability to secure substantial contracts indicates its strong position and potential to capitalize on future opportunities within the governmental sector.
Congressional Alibaba Stock Trades: A Tale of Two Sales
Two notable transactions involving Alibaba Group (BABA) were reported in recent congressional trading activity. On January 19, 2024, Representative Blake Moore (R) from the House of Representatives executed a sale of Alibaba shares valued between $1,001 and $15,000. This transaction was officially reported on January 24, 2024, indicating a relatively modest divestment.
In contrast, a larger transaction was conducted by Representative Laurel Mrs. Lee (R), also from the House of Representatives. She reported a sale of Alibaba stock worth between $100,001 and $250,000, executed on December 29, 2023, and reported on January 4, 2024. This larger divestment suggests a more significant shift in investment strategy or reallocation of assets.
These sales might reflect broader market trends or personal financial strategies. This is particularly true given the ongoing regulatory and geopolitical challenges Chinese companies like Alibaba face.
Disclosures:
Yiannis Zourmpanos has a beneficial long position in the shares of BABA/HK:9988 either through stock ownership, options, or other derivatives. This report has been generated by our stock research platform, Yiazou IQ, and is for educational purposes only. It does not constitute financial advice or recommendations.
