


Market Outlook
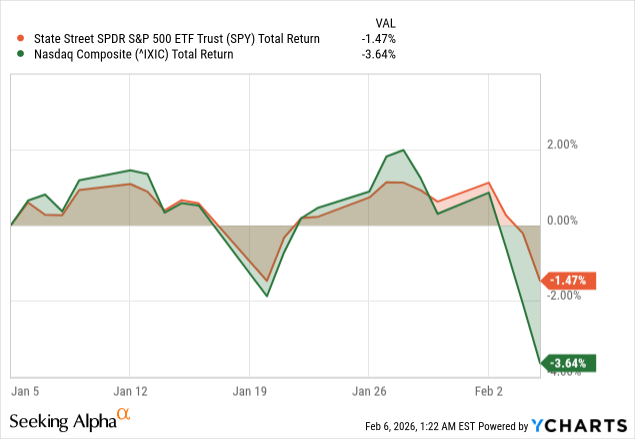
This recent crash I argue, was a focused event, not a general one. Crypto and high-leverage assets have corrected sharply, while US equities have performed well. The S&P 500 traded around 6,900 levels in January 2026, up 15% YoY, while the Nasdaq fell 3-4% YTD, coming off a strong 2025. I believe this is a digestion, not a systemic event, and I expect markets to work their way higher into late winter, while also noting that valuations, leadership, and record leverage are very high and increase the risk of a correction in 2026.
Where the Real Crash Lived
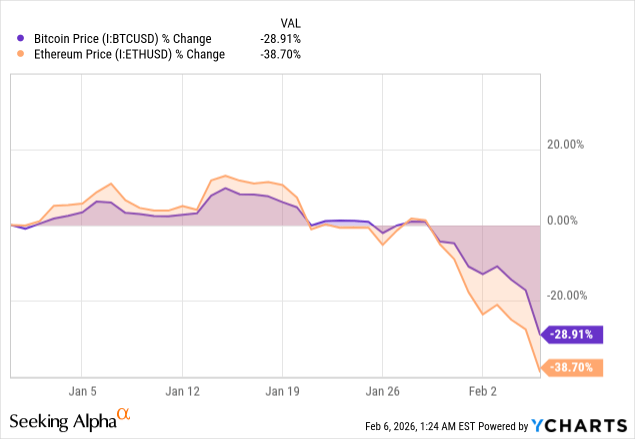
The big move was in crypto, where as of October 6, 2025, Bitcoin reached an all-time high of $126,000, declined to the mid-$80,000s in November, down 32-36%, and then in early February 2026 was trading in the $60,000s, down 50% from the peak. That is a big move, but it is also a very localized move.
I don’t see this as a verdict on global risk appetite. I see this as leverage being unwound where the leverage had been the most aggressive. Bitcoin had rallied from January to October 2025. There was acceleration during the third quarter. This is not the type of price move that corrects well. So when there is a tightening of liquidity, which there is, this type of move is likely to overshoot.
Equities, on the other hand, corrected much more normally. The S&P 500 slightly corrected from the highs to the low in November 2025. This is a normal correction. The important point is that the internals are telling a different story. High beta stocks, which outperformed strongly over the summer, are no longer leading the market. This is a very subtle move, which is typically the way the markets begin to transition to the late stages of the bull market.
The AI Trade Grows Up: From Hype to Hard Economics
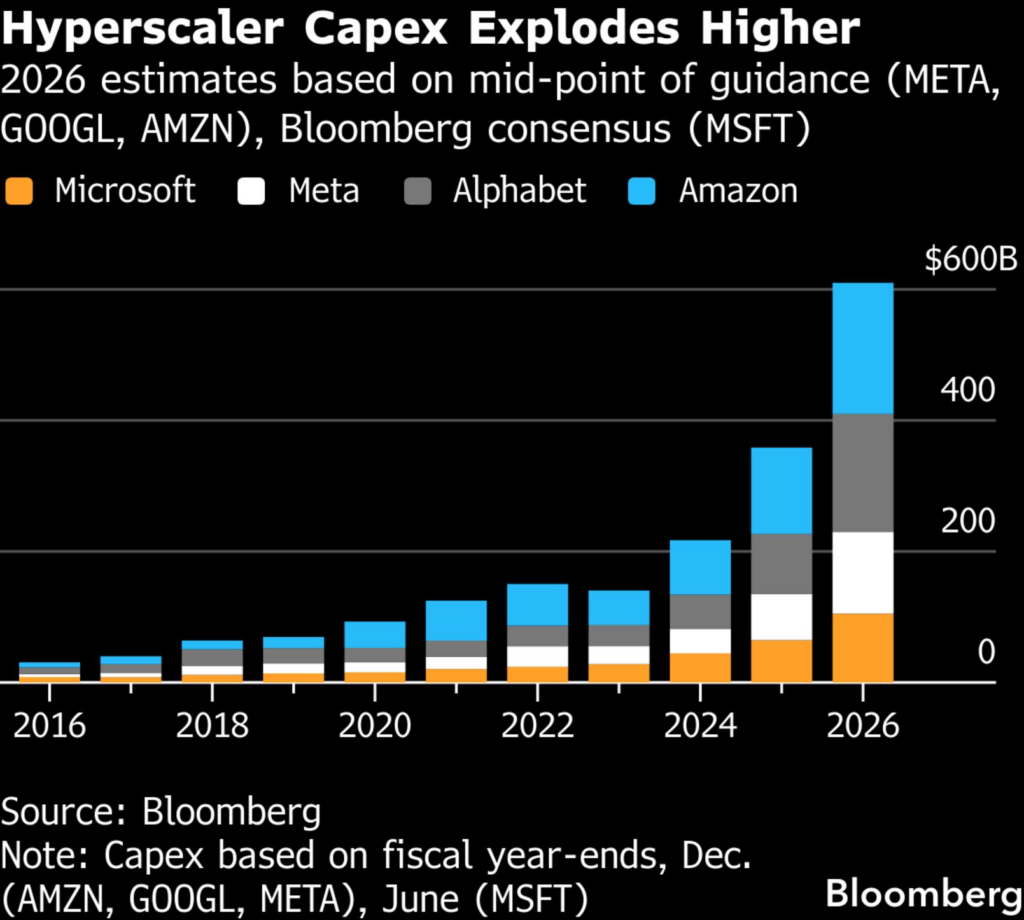
I don’t see this downdraft as the market turning bearish on AI. I see it as the market finally confronting the economic reality of AI at scale. The shift began when hyperscalers showed just how large and persistent AI capex will be. Alphabet’s ~$175–185B 2026 capex guide wasn’t shocking because of the number, but because it signaled AI is now the core capital cycle, pressuring free cash flow and ROIC.
“More capex” turned bearish because investors are now asking whether the next $50–100B earns acceptable returns. An arms-race dynamic, uneven monetization visibility, and rising internalization of the stack are capping confidence in margins and pricing power.
This has hit high-beta infrastructure and AI-exposed software hardest, amplified by crowded positioning and leverage. I see this as a repricing, not a collapse. AI remains central, but the easy narrative phase is over. Execution, capital efficiency, and real cash returns now matter most.
Macro Data Still Supports the Tape
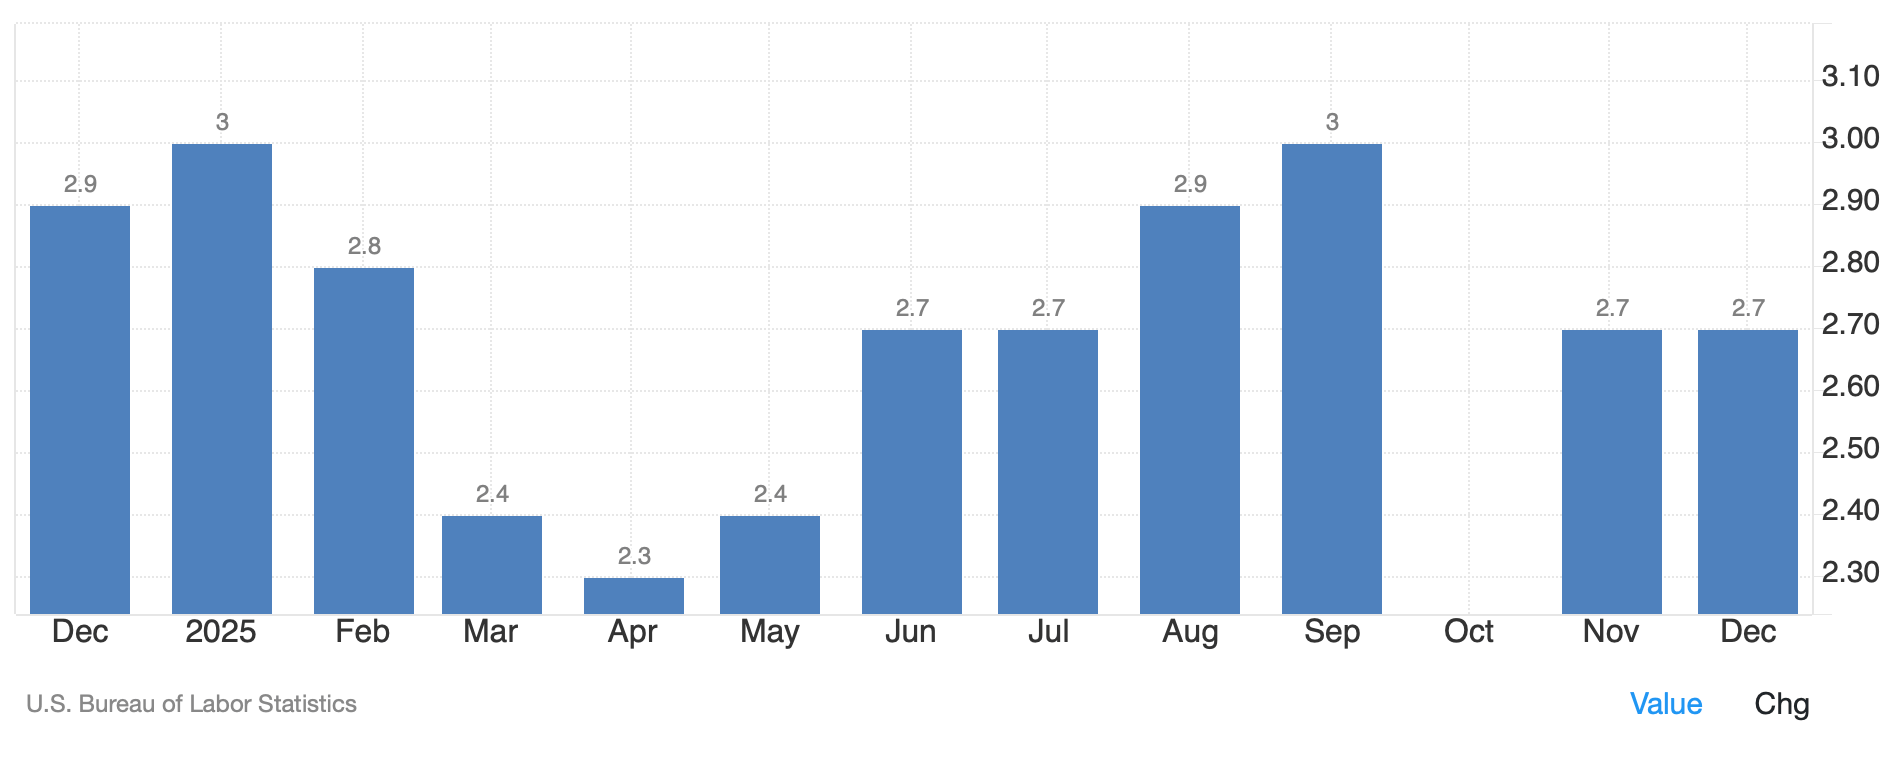
I’d like to be precise here, without being overly so. The macro environment isn’t recessionary, nor is it one where things are going great and can be ignored. Growth was healthy in the second half of 2025, inflation came down into the high 2%, and policy rates are at 3.5-3.75%, with the Fed on hold.
This, in summary is why equities didn’t tank alongside crypto. There was no macro event that caused indiscriminate selling. And yet, it’s also why risk assets are no longer cheap. A pause at high levels isn’t the same as stimulus. You’re maintaining the floor yes, but you’re not justifying multiples going to infinity. So, the macro environment isn’t all good nor recession in six months. It’s late cycle, meaning growth is still good, inflation isn’t scary, and assets are already expensive.
Valuations and Concentration: The Quiet Risk
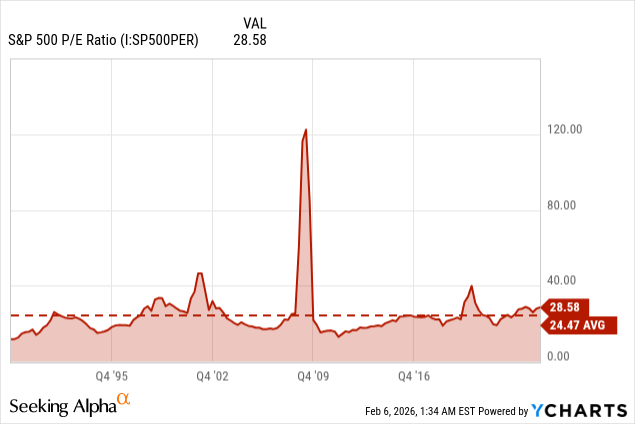
Where I would be cautious is in terms of valuation and structure. Coming into 2026, the S&P 500 was trading at about 28 to 29 times trailing earnings, the Shiller CAPE is also near 30, double its median of 15x which is well above long-term averages, though below the extremes of 1999–2000.
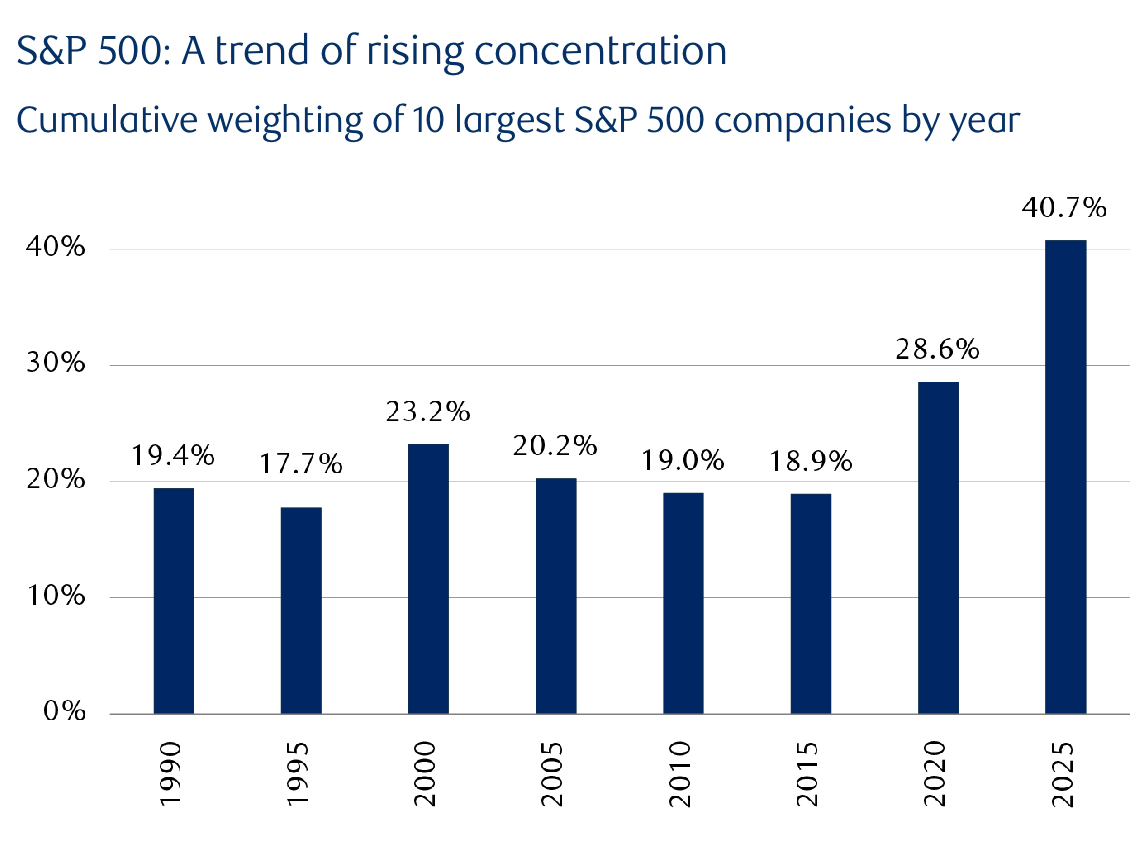
This risk is much higher because of concentration. The top 10 stocks currently represent about 40-42% of the market capitalization of the S&P 500, compared to the 29% peak during the dot.com bubble. The Mag7 represent about one-third of the S&P 500 and have produced over 35% of all S&P 500 index gains since the October lows. We can understand the behavior and the reasons behind this. As long as some of these mega caps are holding, everything is fine.
Finally, high beta stocks peaked on an intermediate basis around October 2025. Since then, they’ve been underperforming and struggling. The Magnificent 7 index was up only around 0.5% YTD as of early 2026 compared to around 1.8% for the S&P 500. Forward multiples compressed down to around 29x from the low 40s. Still very rich. It’s not a collapse. It’s a shift from effortless beta to selective risk.
Positioning and Leverage Are the Real Fault Lines
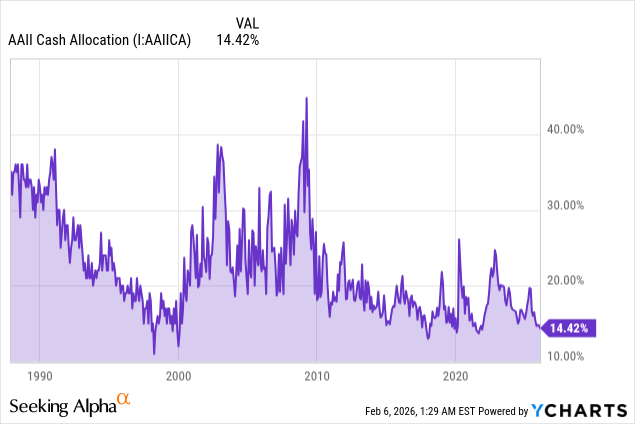
Sentiment data confirms that we are indeed in a late-stage bubble. Investors’ sentiment data shows that retail investors’ allocation to equities was about 70-71% of their portfolios through late 2025 and early 2026, versus a long-run average of about 62%. Meanwhile, cash levels were about 14-15%, versus a long-run average of about 22%.
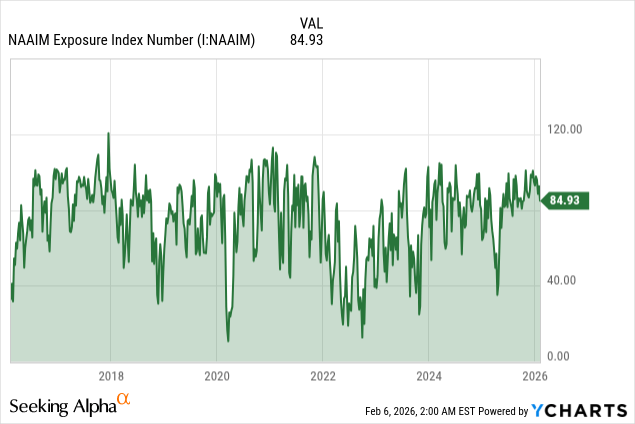
The sentiment information of professional investors was not much different either, as the NAAIM Exposure Index was around 85 which again meant that they were almost fully invested and leveraged as well.
Cycles and the February-March Window
While I do not utilize cycles for timing, I do respect cycles that align with positioning and price action. There are several long-term cycle composites that are indicating continued strength or stability through mid-February to late March, followed by a higher risk period later in 2026.
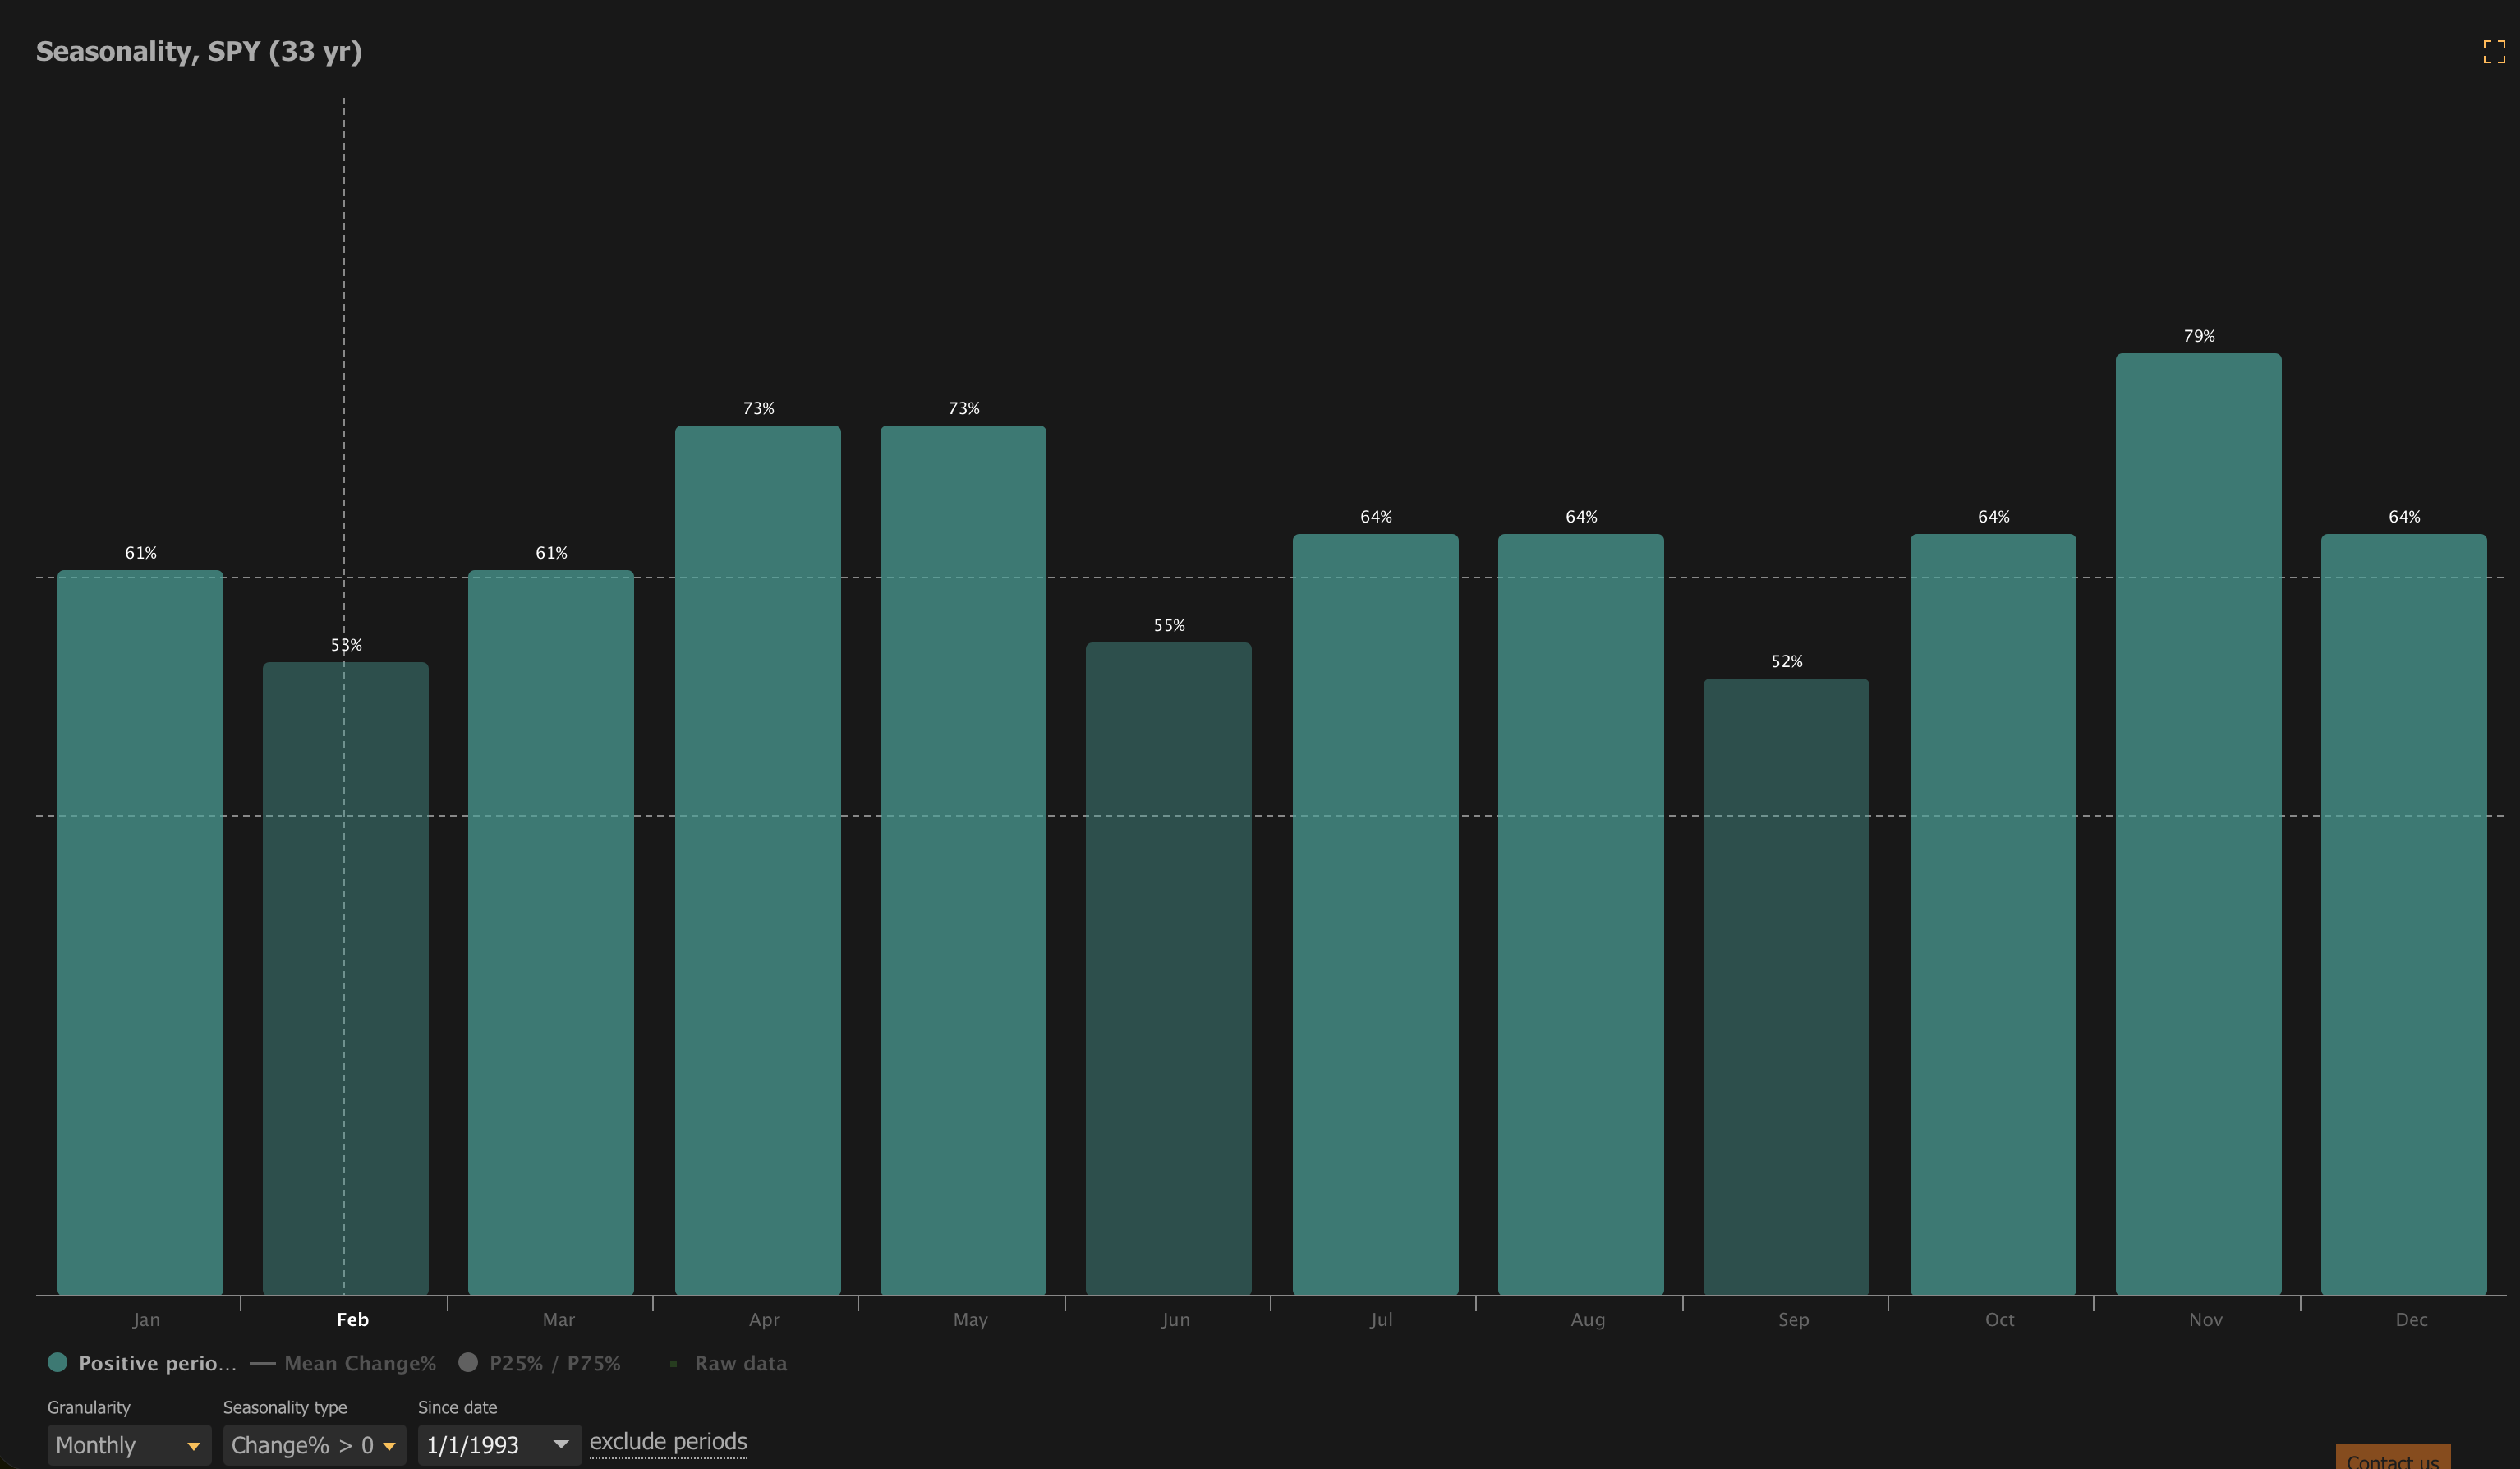
For example the seasonality chart, based on 33 years of price history in the SPY, shows that the market tends to have positive monthly returns 61% of the time in January and March, increasing to 73% in April and May. In contrast, the month of February is quite soft, with only 53% of the time having positive results, which is consistent with the concept of the market experiencing choppiness before ultimately breaking down.
The Risk That Most Investors Overlook
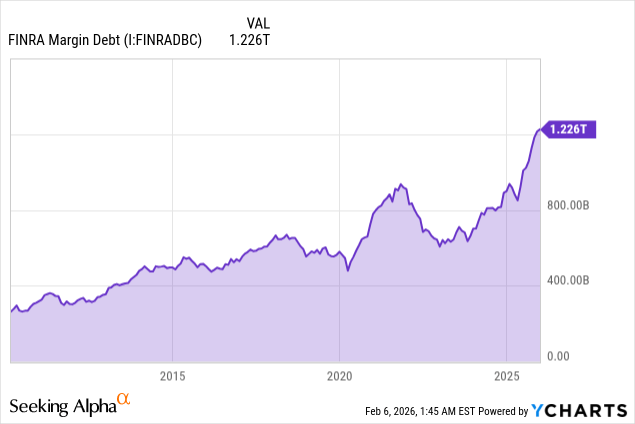
Most investors are worried about a coming 5-10% pullback. I think this is a mistake. The risk I see is what happens if leverage unwinds in a concentrated market. With margin debt at $1.2 trillion, a 10% drop is not a market correction. It’s a forced selling event. This is what turns a late-cycle correction into a larger event.
I do not know about you, but every time this has happened before, and every time margin debt has risen this much the market ended badly and ended badly quickly, not after some protracted and drawn-out period of time. 2000, 2007, 2021, all ended badly once the market started to roll over. I do not think that has happened yet.
Takeaway
I don’t think this sell-off represents the end of the bull market. I think it represents a reset and a reminder of how dependent prices are on leverage and narrow leadership. I think we can grind higher through the end of winter (late February to March).
Beyond that, the math gets ugly. With stretched valuations, crowded positioning, and extreme leverage, I think the probability of a 15-25% equity correction at some point in 2026 is meaningfully higher. It wasn’t the end. It was the warning. And as we know, those are given out before the actual event occurs.