


UiPath’s Automation Edge: Industry Applications and Growth Potential
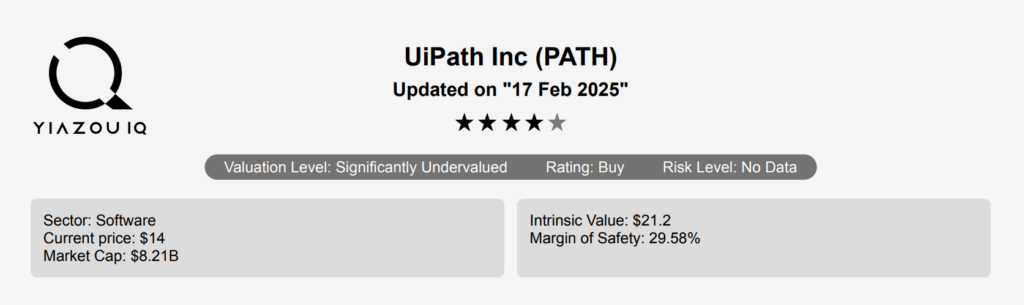
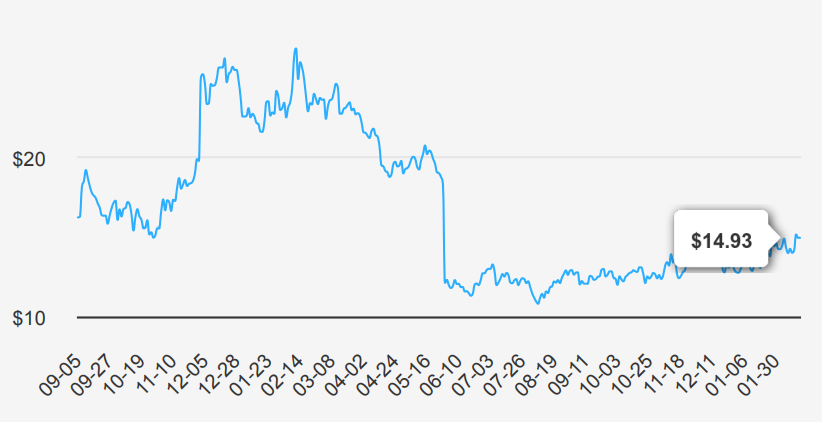
UiPath offers an end-to-end cross-application enterprise automation platform. The platform leverages a range of automation technologies, including robotic process automation, application programming interfaces, and artificial intelligence. UiPath’s solution can automate a broad range of repetitive tasks across industries including claims processing, employee onboarding, invoice to cash, loan applications, and customer service. UiPath stock is currently trading at ~$15.
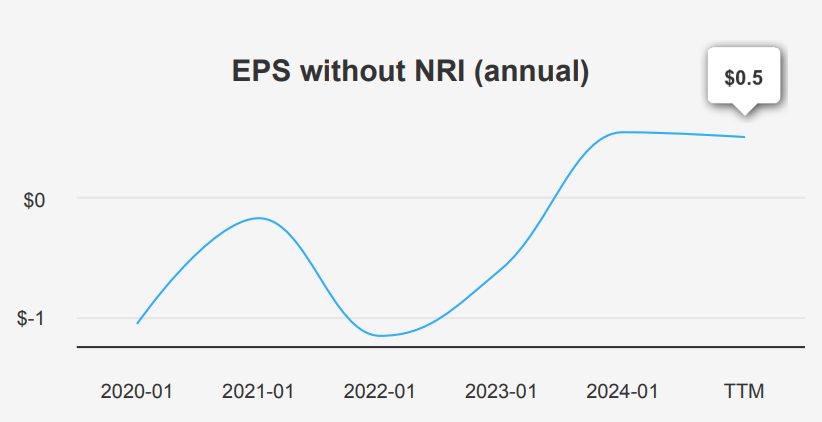
UiPath’s EPS Trends: Improvement or Ongoing Struggles?
In the latest quarter ending October 31, 2024, PATH reported an EPS without non-recurring items (NRI) of $0.11, marking a significant improvement from $0.04 in the previous quarter and a slight decrease from $0.12 in the same quarter last year. The company’s diluted EPS, which includes extraordinary items, was -$0.02 against -$0.15 in the previous quarter, indicating a narrowing of losses. Revenue per share rose to $0.644 from $0.557 in the previous quarter, underscoring a positive trajectory in core operations. Over the past five and ten years, PATH’s annual EPS without NRI has shown no growth, indicating a need for strategic pivots to foster profitability.
PATH’s gross margin remained robust at 83.30%, slightly above its five-year median of 82.99%, reflecting efficient cost management. The company’s share buyback activity is limited, with a one-year buyback ratio of 3.10%. It indicates that 3.10% of outstanding shares were repurchased, which can enhance EPS by reducing the number of shares outstanding. However, the three-year buyback ratio shows a negative trend at -3.10%, suggesting previous net share issuances. The minimal change in the buyback ratio over five and ten years indicates a stable share management approach.
The industry forecast suggests a growth rate of approximately 8% annually over the next decade, creating a favorable backdrop for PATH. Analysts estimate PATH’s revenue to grow from $1,431.13 million in 2025 to $1,751.62 million by 2027, reflecting confidence in long-term prospects despite short-term EPS challenges. The next earnings report is on March 12, 2025, with an estimated EPS of -$0.191 for the next fiscal year, suggesting ongoing operational adjustments are necessary for future profitability.
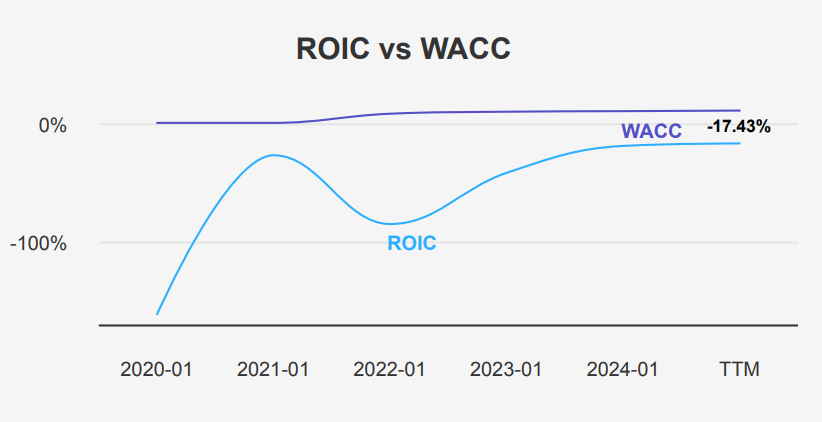
ROIC vs. WACC: Is UiPath Creating or Destroying Value?
Analyzing PATH’s financial performance through its Return on Invested Capital (ROIC) and Weighted Average Cost of Capital (WACC) reveals some concerning insights into its economic value creation. The data indicates that PATH’s ROIC is consistently negative, with a median of -42.35% over five years and a current rate of -17.43%. This is significantly below the WACC, which has a five-year median of 9.46% and a current rate of 10.44%. Such a disparity suggests that PATH is not generating sufficient returns to cover its cost of capital, implying that the company is destroying rather than creating value.
The negative ROIC, when compared to the positive WACC, highlights inefficiencies in capital allocation and operational performance, as the company’s returns are insufficient to justify the capital costs. This negative gap suggests that strategic adjustments are necessary for PATH to improve its financial health and enhance shareholder value. Without improvements, PATH stock may struggle to attract investors who are typically seeking positive value creation through efficient capital use.
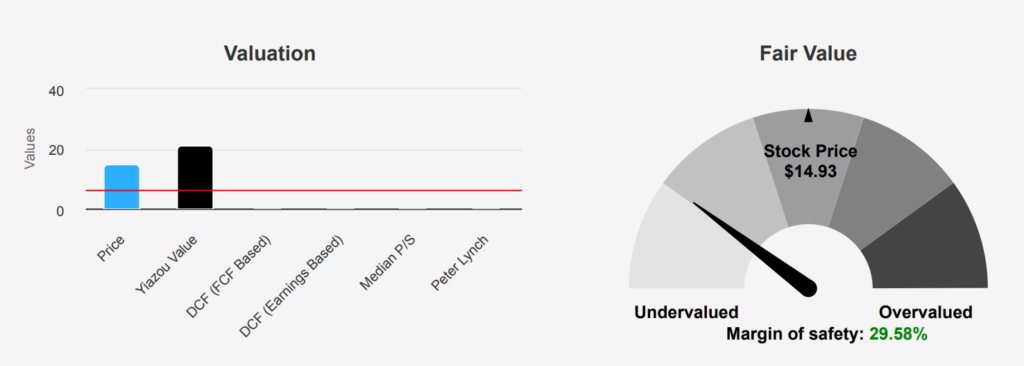
UiPath Stock’s 29.58% Margin of Safety: Undervalued or Justified?
PATH stock’s valuation presents a mixed picture. The intrinsic value of $21.2 compared to the current price of $14.93 provides a margin of safety of 29.58%, suggesting potential undervaluation. However, the Forward P/E ratio of 29.05 indicates that investors are paying a premium for future earnings, which could be a concern if expected growth does not materialize. The P/S ratio TTM of 5.96 is slightly below its 10-year median of 8.58, reflecting a more reasonable valuation relative to past highs. The PB ratio TTM of 4.74 is also under its 10-year median of 5.04, indicating a fair valuation on a book value basis.
The TTM EV/EBITDA of -41.72 is notably concerning, as it reflects ongoing operational losses, deviating from its 10-year median of -34.02. Such a negative figure highlights challenges in achieving positive earnings before interest, taxes, depreciation, and amortization, which could be a red flag for potential investors. The Price-to-Free-Cash-Flow TTM of 27.44 is within a reasonable range against its 10-year median but suggests that the company is relatively expensive against the cash flow it generates despite being far below its historical extremes.
Analyst sentiment, as indicated by stable price targets over the past few months, suggests a cautious outlook with little expectation of rapid price movement. With 25 analyst ratings, the consensus seems to lean towards a hold, reflecting uncertainty about PATH’s ability to convert its intrinsic value advantage into real stock performance. Given the negative earnings metrics and current valuation ratios, potential investors should weigh the margin of safety against potential risks, particularly if the company cannot improve its profitability metrics.
UiPath Stock’s Strengths vs. Insider Selling: Should Investors Worry?
UiPath stock presents a mixed risk profile based on recent insider activity and its financial metrics. The sale of 127,227 shares by insiders in the last three months could raise concerns about internal confidence in the company’s near-term prospects. Such transactions often indicate that insiders may expect limited upside or foresee potential challenges ahead. However, the absence of insider buying suggests a level of caution or uncertainty about the stock’s immediate performance.
On the positive side, UiPath demonstrates robust financial health, as evidenced by its ability to cover all debts with available cash and a strong Altman Z-score of 5.29, which indicates a low risk of financial distress. The Beneish M-Score of -3.13 further suggests that the company is unlikely to be manipulating its financial statements, enhancing its credibility and stability. Additionally, a sound interest coverage ratio aligns with Ben Graham’s investment criteria, reflecting the company’s capacity to meet its financial obligations comfortably.
Overall, while insider selling may signal some caution, UiPath’s solid financial fundamentals provide a counterbalance, suggesting that the stock remains a relatively stable investment with manageable risks.
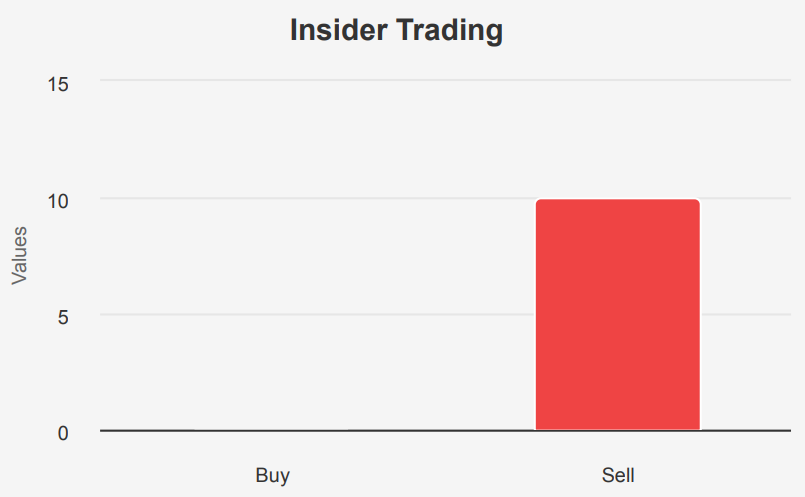
Consistent Insider Selling: A Warning Sign for Investors?
In the past year, UiPath stock has shown a consistent trend of insider selling activity with no insider purchases recorded. Over the last 12 months, 10 insider sales have been executed, with 7 sales in the past six months and 3 within the last quarter. This pattern suggests a possible lack of confidence among the company’s directors and management in the short-term appreciation of the stock’s value.
Insiders currently own 6.96% of the company, indicating a moderate level of personal stake in the business. However, the lack of buying interest from insiders could imply that they perceive the stock as fairly valued or potentially overvalued at current prices. On the other hand, institutional ownership stands at 53.90%, reflecting strong institutional interest which can suggest confidence in the company’s long-term prospects despite recent insider sale trends.
Investors may consider these insider activities as potential signals of future stock performance while weighing them against broader market conditions and company fundamentals.
UiPath Stock’s Trading Volume and Institutional Interest: What It Means
The liquidity and trading analysis for PATH stock indicates moderate activity. With a current daily trading volume of approximately 7,423,290 shares, the stock is actively traded, although this figure is slightly below the average daily volume of 8,294,628 shares over the last two months. This suggests a recent decrease in trading interest or liquidity.
The DPI (Dark Pool Index) measures for PATH are as follows: 45% for buys and 42% for sells. The buy-side DPI of 45% suggests that a significant portion of trades are on dark pools, potentially indicating institutional interest or large block trades occurring outside public exchanges. Conversely, the sell-side DPI of 42% indicates a slightly lower, but still substantial, level of selling activity in dark pools.
Overall, PATH’s trading environment is characterized by active participation, with notable dark pool activity that suggests significant institutional involvement. However, the drop below the average daily volume may warrant closer monitoring for shifts in investor sentiment or broader market conditions affecting the stock’s liquidity.
Disclosures:
On the date of publication, Yiannis Zourmpanos did not hold (either directly or indirectly) any positions in the securities mentioned in this article. This report has been generated by our stock research platform, Yiazou IQ, and is for educational purposes only. It does not constitute financial advice or recommendations.