GOOG Stock: Solid Business Model and Revenue Composition
Alphabet (GOOG) is a holding company that wholly owns internet giant Google. The California-based company derives slightly less than 90% of its revenue from Google services, the vast majority of which is advertising sales. Alongside online ads, Google services houses sales stemming from Google’s subscription services (YouTube TV, YouTube Music among others), platforms (sales and in-app purchases on Play Store), and devices (Chromebooks, Pixel smartphones, and smart home products such as Chromecast). Google’s cloud computing platform, or GCP, accounts for roughly 10% of Alphabet’s revenue with the firm’s investments in up-and-coming technologies such as self-driving cars (Waymo), health (Verily), and internet access (Google Fiber) making up the rest. GOOG stock is currently trading at ~$197. Let’s assess GOOG intrinsic value.

2024 EPS Trends and Revenue CAGR Insights
In the third quarter of 2024, Google (GOOG) reported an EPS without NRI (excluding non-recurring items) of $1.986, reflecting a modest increase from the previous quarter’s $1.972 and a significant rise from the $1.636 reported in the same quarter last year. The EPS (Diluted) also showed improvement, reaching $2.12 from $1.89 in the prior quarter and $1.55 a year ago. Revenue per share increased to $7.107, up from $6.782 in Q2 2024 and $6.041 in Q3 2023. Over the past five years, the annual EPS without NRI has grown at a CAGR of 25.90%, while the 10-year CAGR stands at 21.80%.
Google’s gross margin for Q3 2024 was 57.85%, slightly above its 5-year median of 55.58% but below the 10-year high of 62.44%. The company’s robust margins are supported by efficiencies in its core advertising business and growth in cloud services. The share buyback ratio over the past year was 2.20%, indicating that 2.20% of shares previously outstanding were repurchased, enhancing EPS by reducing the share count. Over three years, the buyback ratio averaged 2.60%, demonstrating a consistent commitment to returning value to shareholders.
Looking forward, analysts estimate Google’s revenue to grow from $350.1 billion in 2024 to $431.3 billion by 2026, suggesting a strong industry presence and expansion potential. The estimated EPS for the next fiscal year is $8.016, rising to $8.934 the following year. These projections align with industry forecasts projecting a 10-year growth rate of 9%, driven by continued digital transformation and increased cloud adoption. Google’s next earnings announcement is on January 30, 2025, providing further insights into its strategic initiatives and financial health.

ROIC Exceeds WACC, Driving Shareholder Value
GOOG’s financial performance reveals robust capital allocation and significant economic value creation. The company’s Return on Invested Capital (ROIC) consistently surpasses its Weighted Average Cost of Capital (WACC), indicating efficient use of its capital to generate returns. Specifically, the ROIC (5-year median) stands at 29.25%, while the WACC (5-year median) is 8.01%. This substantial gap highlights GOOG’s ability to create value well above its cost of capital.
In the most recent analysis, the ROIC is 32.52%, compared to a WACC of 9.95%. This further illustrates that GOOG is generating positive economic value, as its returns exceed the cost required to maintain its capital. The high ROIC also reflects effective management and strategic investment decisions, contributing to GOOG intrinsic value. Overall, GOOG’s financial strategy, as evidenced by its high ROIC relative to WACC, underscores its successful financial efficiency and longterm value generation for investors.

Consistent DPS Amid Low Payout Ratio
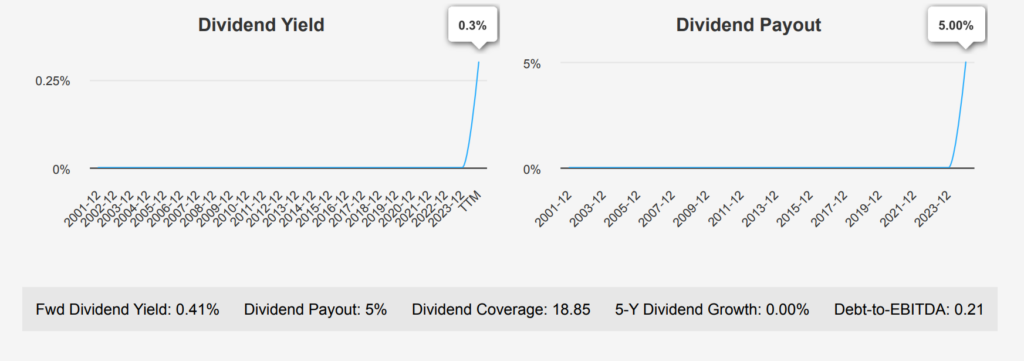
Moving beyond GOOG intrinsic value, the stock has shown no growth in dividends over the past five years, maintaining a consistent dividend per share (DPS) of $0.2 for each quarterly payout. The company’s forward dividend yield stands at 0.41%, which is modest compared to typical yields in its sector. GOOG’s dividend payout ratio is extremely conservative at 5.0%, indicating a significant capacity to increase dividend payouts if desired. However, historical data shows the payout ratio has remained fixed at the 100% mark for the past decade.

Financially, Alphabet is in a strong position with a very low Debt-to-EBITDA ratio of 0.21, well below the 2.0 threshold, suggesting robust debt servicing capacity and low financial risk. Sector comparisons highlight that despite the low yield, Alphabet has exceptional financial leverage and cash reserves, which could potentially support future dividend growth if the company chooses to alter its strategy. The next ex-dividend date set for March 17, 2025, adhering to the quarterly frequency and avoiding weekends.

GOOG Stock’s Premium Price vs. Intrinsic Value
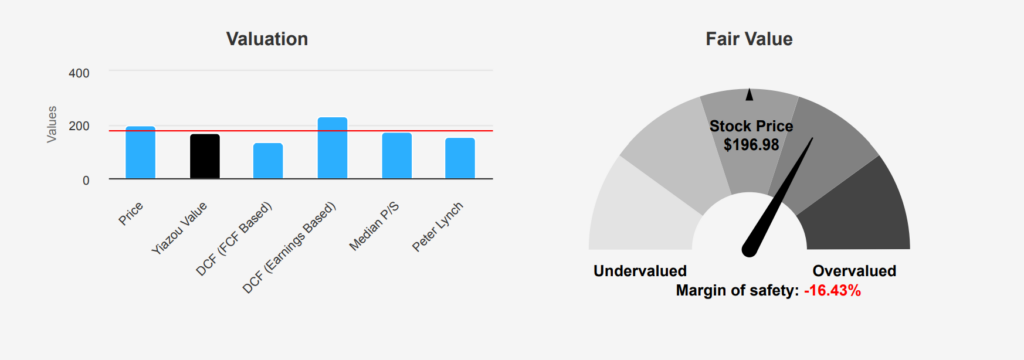
GOOG’s current valuation metrics indicate a potential overvaluation compared to its intrinsic value of $169.17, with the stock trading at $196.98, indicating a negative margin of safety of -16.44%. This suggests that the stock is trading above its estimated intrinsic worth, which can be a cautionary signal for value-focused investors. The TTM P/E ratio stands at 25.94, slightly below the 10-year median of 28.55, suggesting a valuation that is not excessively high in historical terms, yet still potentially rich given the intrinsic value shortfall.
The TTM EV/EBITDA ratio is 18.43, close to the 10-year median of 17.33, indicating that on an enterprise value basis, GOOG is trading around its historical norms. However, the TTM Price-to-Free-Cash-Flow ratio at 44.65 is at its 10-year high, which may signal overvaluation concerns, especially when juxtaposed with the intrinsic value discrepancy. The TTM P/B ratio of 7.63 is also above the 10-year median of 4.81, highlighting a premium to book value, it can be a red flag GOOG intrinsic value.
Analyst sentiment remains positive with a price target of $212.50, suggesting some optimism about future growth. However, given the current metrics, investors should weigh the potential risks of buying at current prices without a clear margin of safety. Monitoring ongoing adjustments in analyst targets, which have been trending upwards, could provide further insights into market expectations and potential corrections in GOOG intrinsic value.

GOOG Stock: Insider Selling and High Valuation Concerns
GOOG stock presents a mixed risk profile with several warning signals. Notably, there have been 18 insider selling transactions, indicating potential concerns from management or investors about future performance. The stock’s Price-to-Book (PB) ratio of 7.63 and Priceto-Sales (PS) ratio of 7.31 are near their respective historical highs, suggesting the stock may be overvalued. These high valuations, alongside the stock price nearing a 10-year high, suggest limited upside potential without strong future growth.
Conversely, Alphabet boasts strong positive indicators. The Piotroski F-Score of 8 suggests excellent financial health, and the company’s interest coverage indicates robust cash reserves, ensuring debt obligations are manageable. The expanding operating margin and consistent revenue and earnings growth reinforce its operational efficiency and stability. Furthermore, a strong Altman Z-score of 15.04 demonstrates financial resilience, reducing bankruptcy risk.
Overall, while Alphabet exhibits significant financial strength and growth potential, investors should remain cautious of its high valuation and insider selling. These factors suggest keeping a balanced approach, weighing the strong fundamentals against the risks of current market pricing pressures.
Trends in Selling and Ownership
The insider trading analysis for GOOG over the past year indicates a notable trend of insider selling activity. Within the last 12 months, there have been 30 insider sell transactions, while there have been no insider buys recorded in the 3, 6, or 12-month periods. This suggests that executives and directors at GOOG have been divesting their shares, potentially reflecting a lack of confidence in the company’s short-term stock performance or possibly for personal liquidity reasons.
The insider ownership of GOOG stands at 3.14%, which, while not negligible, suggests that insiders do not have a significant proportion of the company’s shares. In contrast, institutional ownership is substantially higher at 30.17%, indicating that large financial institutions hold a more considerable stake in the company. This may imply that institutional investors have more influence over the company’s stock price and market perception than its insiders. Overall, the trend of insider selling combined with relatively low insider ownership could warrant further investigation into the motivations behind these transactions.

Daily Volume and Dark Pool Activity
As of the latest data, GOOG demonstrates moderate liquidity with a daily trading volume of 12,721,923 shares, which is below its 2-month average daily trade volume of 19,475,499 shares. This indicates a reduced level of trading activity and could reflect a temporary dip in investor interest or market conditions affecting the stock’s trading dynamics.
The Dark Pool Index (DPI) for GOOG stands at 42%, suggesting that a significant portion of trades are occurring off-exchange, which might impact the price discovery process on public exchanges. This level of DPI could indicate institutional investors are active in the market, potentially executing large trades without significantly affecting the stock’s market price.
Overall, the lower-than-average trading volume combined with a substantial DPI implies that while GOOG might currently experience less public trading activity, significant market movements could occur through private channels, potentially affecting liquidity and price volatility. Investors should consider these factors when making trading decisions, as reduced liquidity can lead to wider bid-ask spreads and increased difficulty in executing large orders without influencing the market price.
Political Confidence in GOOG’s Potential
In recent trading activities by members of Congress, two notable purchases of GOOG stock were reported. On January 2, 2025, Representative James Comer, a Republican from the House of Representatives, executed a purchase transaction valued between $1,001 and $15,000. This transaction was reported on January 10, 2025, and last modified on January 14, 2025.
Earlier, on November 25, 2024, Representative Marjorie Taylor Greene, also a Republican from the House, made a similar purchase of GOOG stock within the same financial range, reported on November 27, 2024, with a last modification on November 28, 2024. These trades indicate continued interest in tech stocks among congressional members, despite fluctuating market conditions. The investments in a major tech company like Google reflect confidence in its potential for growth and stability, which might influence or reflect broader economic strategies or insights within political circles.
Disclosures:
On the date of publication, Yiannis Zourmpanos did not hold (either directly or indirectly) any positions in the securities mentioned in this article. This report has been generated by our stock research platform, Yiazou IQ, and is for educational purposes only. It does not constitute financial advice or recommendations.


