Apple Stock Forecast: A Foundation for Growth and Innovation
Apple (AAPL) is among the largest companies in the world, with a broad portfolio of hardware and software products targeted at consumers and businesses. Apple’s iPhone makes up a majority of the firm sales, and Apple’s other products, like Mac, iPad, and Watch, are designed with the iPhone as the focal point of an expansive software ecosystem. Apple has progressively worked to add new applications, like streaming video, subscription bundles, and augmented reality. The firm designs its own software and semiconductors while working with subcontractors like Foxconn and TSMC to build its products and chips. Slightly less than half of Apple’s sales come directly through its flagship stores, with a majority of sales coming indirectly through partnerships and distribution. AAPL stock is currently trading at $238. Let’s dive into Apple stock forecast.

EPS Grows 18.9% CAGR; $476B Revenue by 2027
Apple reported a strong earnings performance for the quarter ending September 30, 2024, with EPS without NRI (excludes non-recurring items) reaching $1.64, an improvement from $1.40 in the previous quarter (QoQ) and $1.46 in the same quarter last year (YoY). Revenue per share also increased to $6.228 from $5.589 in the prior quarter and $5.711 a year ago. The company’s 5-year Compound Annual Growth Rate (CAGR) for annual EPS without NRI stands at 18.90%, with a 10-year CAGR of 15.90%. Industry forecasts suggest a healthy growth trajectory for the technology sector, with an expected annual growth rate of around 6-7% over the next decade.
Apple’s gross margin for the quarter was 46.21%, matching its 10- year high, significantly above the 5-year median of 43.31% and the 10-year median of 39.57%. This indicates strong operational efficiency and pricing power. The company’s aggressive share buyback program continues to positively affect EPS by reducing the number of outstanding shares, thereby increasing the earnings per share. Over the past year, Apple repurchased 2.80% of its shares, contributing to its 5-year buyback ratio of 3.10%. This strategy underscores Apple’s commitment to returning value to shareholders and enhancing EPS.
Looking ahead, analysts estimate Apple’s revenue to reach $414.04 billion in 2025, growing to $476.20 billion by 2027. The estimated EPS for the next fiscal year ending is $7.410, with an increase to $8.298 the following year, reflecting optimism about Apple’s growth prospects. The next earnings announcement is on January 30, 2025, where further insights into Apple’s strategic direction and performance outlook will be anticipated. With strong fundamentals and robust market positioning, Apple is well-placed to capitalize on future growth opportunities.

Apple Stock’s ROIC Exceeds WACC: Sustained Value Creation
Apple stock demonstrates strong financial efficiency and effective capital allocation, as evident in its Return on Invested Capital (ROIC) consistently surpassing its Weighted Average Cost of Capital (WACC). Over a five-year median, AAPL’s ROIC stands at 33.41%, significantly higher than its WACC of 10.63%. This indicates that the company is creating substantial economic value by generating returns well above its cost of capital, thus enhancing shareholder value.
In the most recent figures, AAPL maintains an ROIC of 32.51%, compared to a WACC of 11.57%. This consistent performance highlights Apple’s capability to reinvest in its business profitably, sustaining its competitive advantage and financial health over time. The high ROIC relative to WACC underscores Apple’s strategic efficiency in utilizing its capital to generate profitable returns. This not only reflects strong operational performance but also strategic foresight in investment decisions. Overall, Apple’s ability to maintain an ROIC above its WACC consistently positions it as a value-generating enterprise that is attractive to investors seeking robust financial returns.

Dividend Growth Remains Modest Amid Strong Financial Health
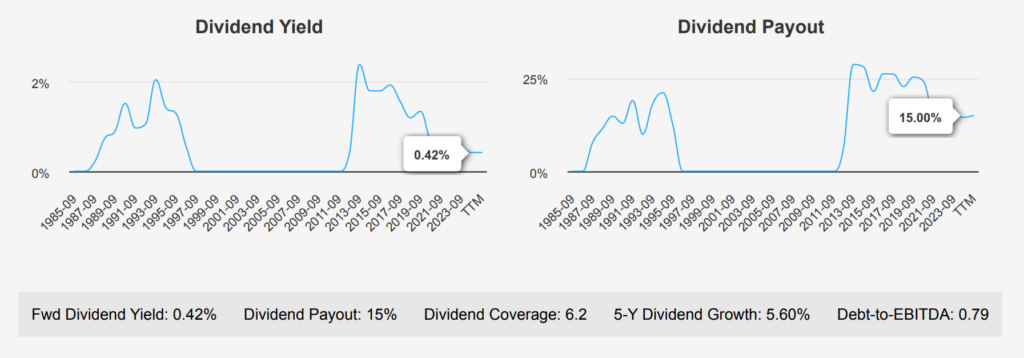
AAPL stock has shown consistent dividend growth, with a 5- year growth rate of 5.60% and a 3-year rate of 4.90%. In the most recent quarter, Apple increased its dividend to $0.25 per share, up from $0.24 previously, reflecting a continued commitment to returning value to shareholders. The forward dividend yield is modest at 0.42%, mainly due to the significant appreciation in stock price, which is a common trend in the technology sector.

Apple’s debt-to-EBITDA ratio is a low 0.79, highlighting its strong capacity to service debt and indicating minimal financial risk. This is favorable against general industry guidelines, which consider a ratio below 2.0 as strong.
The company’s dividend payout ratio is also conservative at 15%, well below its historical highs, providing ample room for future dividend increases. The estimated future dividend growth rate over the next 3-5 years is projected at 4.77%, suggesting continued, albeit modest, growth under Apple stock forecast. The next ex-dividend date is on February 7, 2025, given the quarterly dividend schedule. This reflects Apple’s ongoing strategy of consistent, reliable dividend payments.

Apple Stock Forecast: Intrinsic Value Suggests -26.75% Margin of Safety
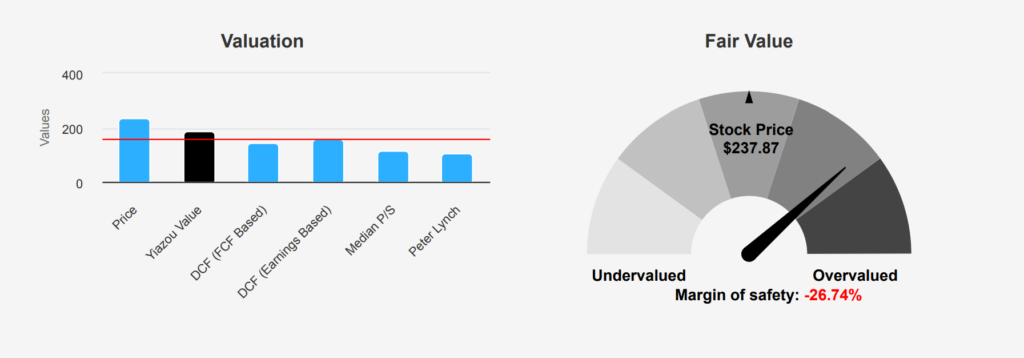
AAPL stock is currently trading at $237.87, which is significantly higher than its intrinsic value of $187.67, resulting in a negative margin of safety of -26.75%. This suggests that the market price does not provide a buffer for potential valuation errors or market volatility. The current valuation metrics indicate that AAPL is trading at the higher end of its historical range. For instance, the TTM P/E ratio of 39.12 is above its 10- year median of 22.01, though it remains below the historical high of 42.04. Similarly, the TTM EV/EBITDA ratio stands at 26.36, compared to a 10-year median of 15.17, indicating a premium valuation.
Further analysis shows that AAPL’s TTM P/S ratio is 9.39, close to its 10-year high of 10.08, and significantly above the median of 4.77. The TTM Price-to-Free-Cash-Flow ratio is 33.73, which is also above the median of 20 but below its high of 36.23. Notably, the TTM Price-toBook ratio is exceptionally high at 63.1, compared to a median of 13.67, suggesting that the stock is trading at a substantial premium relative to its book value. These elevated valuation metrics may indicate that AAPL is overvalued compared to its historical norms.
Despite these high valuations, the market sentiment remains positive, with the latest price target at $243.99, slightly above the current price. Analysts following the stock suggest a stable outlook, with the price target slightly increasing over the past few months. This might reflect confidence in the company’s continued growth prospects and market leadership, albeit with caution due to the absence of a margin of safety under Apple stock forecast. Investors should weigh these factors carefully, particularly in light of AAPL’s premium valuation metrics.

High Valuation Risks Offset by Financial Strength
Apple stock forecast presents a mix of both high valuations and robust financial health. The stock is trading near its 10-year highs across several valuation metrics, including PB, PE, and PS ratios, indicating potential overvaluation risks. The PB Ratio is notably high at 61.93, while the PE Ratio of 38.37 and PS Ratio of 9.19 are also near their historical peaks. Furthermore, the dividend yield is close to a decade low, which may deter income-focused investors. Recent insider selling, with 304,130 shares sold and no insider buying, adds a cautionary note regarding the stock’s future performance.
Despite these valuation concerns, Apple demonstrates strong financial health with a Piotroski F-Score of 7, suggesting efficient operations and financial stability. The Beneish M-Score of -2.77 indicates a low risk of financial manipulation. Additionally, Apple’s operating margin is expanding, a positive sign for profitability, and the Altman Z-score of 8.87 reflects a very low risk of bankruptcy. However, investors should be mindful of slowing revenue growth over the past year, which might impact future earnings and stock performance. Balancing these factors, investors should weigh Apple’s strong financial fundamentals against its high market valuation.
19 Insider Sales in 12 Months; Institutional Confidence Remains High
Over the past year, insider trading activity for Apple has predominantly involved selling, with no insider purchases recorded in the last 3, 6, or 12 months. In the most recent 3-month period, there were 3 insider sales, increasing to 11 over the past 6 months, and totaling 19 sales over the last 12 months. This consistent selling trend may suggest that insiders are capitalizing on high stock valuations or reallocating their portfolios. However, it’s important to note that insider ownership is relatively low at 0.11%, which may limit the impact of these sales on the stock’s performance.
In contrast, institutional ownership is significant at 68.96%, indicating strong interest and confidence from institutional investors, which could provide stability to the stock’s price. While insider sales can sometimes be a red flag, the robust institutional backing for AAPL might suggest continued positive sentiment and investment in the company’s future prospects.

Strong Market Liquidity with 39M Shares Traded Daily
Apple stock demonstrates robust liquidity and trading activity, significant for investors seeking efficient entry and exit points. The current daily trading volume is approximately 39,574,291 shares, suggesting strong market participation, though it slightly trails the two-month average daily volume of 45,906,168 shares. This comparison indicates a recent dip in trading activity, which could be attributed to market conditions or investor sentiment shifts.
The Dark Pool Index (DPI) for AAPL stands at 37.62%, reflecting the proportion of the stock traded in non-public exchanges. A DPI below 50% generally implies that a smaller fraction of trades occur in dark pools, suggesting transparency and potential influence from public market trading trends. This level of dark pool activity may indicate a balanced trading environment, where public sentiment plays a crucial role in price movements.
Overall, AAPL’s trading metrics reveal a highly liquid market with ample trading volume, facilitating smooth transactions. Investors should monitor any fluctuations in trading volume or DPI as these could signal changes in liquidity conditions or market dynamics. Maintaining awareness of these factors can aid in making informed investment decisions regarding AAPL.
Bipartisan Interest in Apple Stock: Modest Purchases in 2024-2025
In early 2025, two notable trades in Apple stock were reported by members of the U.S. House of Representatives. On January 10, 2025, Representative James Comer, a Republican, disclosed a purchase of Apple shares valued between $1,001 and $15,000. This transaction occurred on January 2, 2025, shortly after the new year began. In a separate transaction, Representative Josh Gottheimer, a Democrat, reported a purchase of Apple shares within the same value range on December 19, 2024. His report was filed on January 14, 2025. These trades suggest a bipartisan interest in Apple, possibly reflecting confidence in the tech giant’s performance or strategic positioning in the market. Both transactions were relatively modest in scale, indicating a cautious but optimistic investment approach by the representatives. The timing of these trades, around the start of the new year, might also be strategic for portfolio adjustments.
Disclosures:
On the date of publication, Yiannis Zourmpanos did not hold (either directly or indirectly) any positions in the securities mentioned in this article. This report has been generated by our stock research platform, Yiazou IQ, and is for educational purposes only. It does not constitute financial advice or recommendations.


