Realty Income’s Diverse Property Portfolio and Revenue Breakdown
Realty Income owns roughly 15,400 properties, most of which are freestanding, single-tenant, triple-net-leased retail properties. Its properties are located in 49 states and Puerto Rico and are leased to 250 tenants from 47 industries. Recent acquisitions have added industrial, gaming, office, manufacturing, and distribution properties, which make up roughly 20% of revenue.

EPS Trends and Revenue Projections for Realty Income Corp
In the third quarter ending September 30, 2024, O reported an EPS (Earnings Per Share) without NRI (non-recurring items) of $0.36, showing a slight decrease from $0.368 in the previous quarter but an increase from $0.348 in the same quarter last year. This reflects a solid performance compared to a year ago, with a 5- year CAGR of 0.90% and a 10-year CAGR of 5.60%. The company’s revenue per share was $1.526, marginally lower than the previous quarter’s $1.538. This modest fluctuation in earnings indicates a stable financial performance over the short term.
O’s gross margin stood at 92.75%, slightly below its 5-year median of 93.58% and its 10-year median of 94.14%, suggesting a slight decrease in profitability efficiency. The company has been actively repurchasing shares, with a 1-year share buyback ratio of -20.90%, significantly impacting its EPS positively by reducing the number of shares outstanding. This buyback ratio indicates that 20.90% of the previous shares were repurchased over the past year, enhancing shareholder value by increasing the earnings attributable to each remaining share.
Looking ahead, analysts estimate O’s revenue to grow progressively, with forecasts of $5,116.53 million for 2024, $5,429.87 million for 2025, and $5,809.58 million for 2026. The estimated EPS for the next fiscal years ending in 2025 and 2026 are $1.276 and $1.633, respectively, indicating anticipated growth. The industry growth forecast for the next decade is approximately 4% annually. O’s next earnings announcement is projected for February 20, 2025, providing further insights into its financial trajectory.

ROIC vs. WACC: Assessing Realty Income’s Value Creation
Analyzing O’s financial performance through its Return on Invested Capital (ROIC) relative to its Weighted Average Cost of Capital (WACC) provides insights into its economic value creation. Over the five-year median, O’s ROIC stands at 3.02%, while its WACC is significantly higher at 6.78%. This indicates that O is not generating sufficient returns on its invested capital to cover its cost of capital, resulting in a destruction of shareholder value.
Furthermore, the current ROIC is at 3.32%, which is still below the recent WACC of 7.32%. This persistent gap suggests ongoing inefficiencies in capital allocation, as the company continues to earn less from its investments than the cost of financing them.
Despite notable peaks in ROIC, such as the 10-year high of 4.37%, these periods are insufficient to offset the higher cost of capital. Therefore, O needs to reassess its investment strategies and operational efficiencies to enhance ROIC, aiming to exceed WACC for sustainable value creation.

Evaluating Realty Income’s 5.94% Yield and Dividend Sustainability
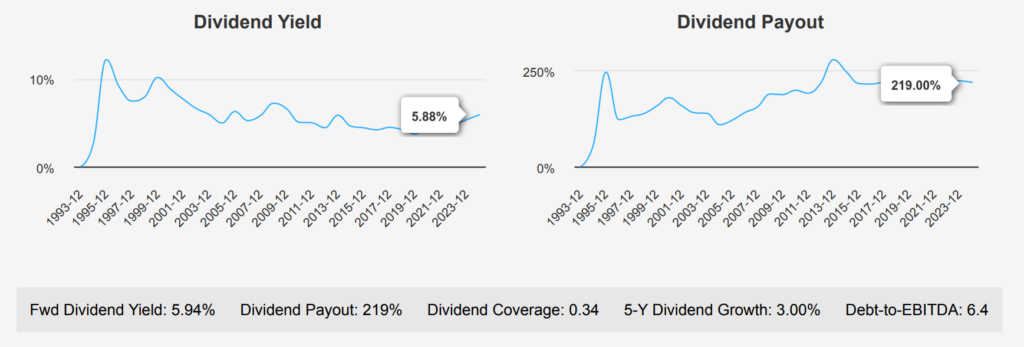
In the most recent quarter, Realty Income Corporation (O) has shown a modest dividend growth, with a 5-year and 3-year dividend growth rate per share of 3.00%. The forward dividend yield stands at 5.94%, which is relatively attractive compared to its 10-year median yield of 4.55%. However, the company’s dividend payout ratio is extremely high at 219%, significantly surpassing its 10-year high of 102.48%. This indicates a potential strain on the company’s cash flow and the sustainability of its dividend payments.

O’s Debt-to-EBITDA ratio is 6.40, which is above the general caution threshold of 4.0, suggesting a higher financial risk and potential challenges in servicing debt. This high leverage might be concerning for investors, especially in rising interest rate environments.
The forecasted 3-5 year dividend growth rate is slightly below historical growth at 2.96%, indicating stable but slow growth prospects ahead. Given the next ex-dividend date of January 2, 2025, and a monthly dividend frequency, the subsequent ex-dividend date can be projected to February 3, 2025 (a Monday), keeping the weekday condition in mind. Investors should monitor the company’s financial health closely, particularly its ability to maintain dividend payouts amidst high leverage.

Realty Income’s Intrinsic Value and Margin of Safety
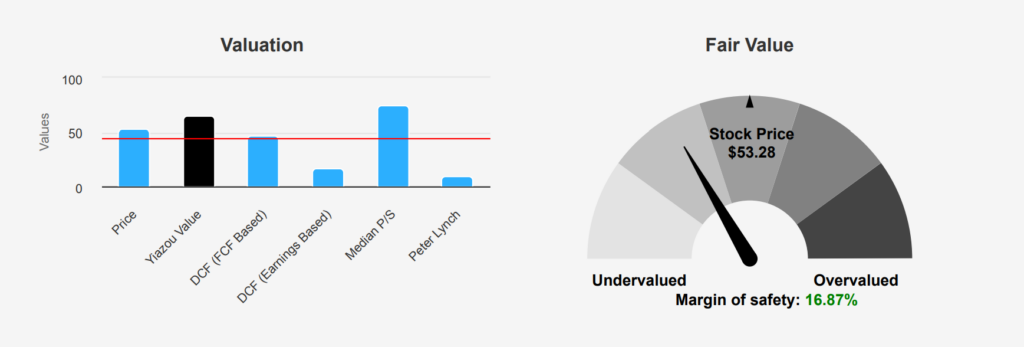
The current intrinsic value of O is estimated at $64.09, significantly higher than its market price of $53.28, offering a margin of safety of approximately 16.87%. This suggests potential undervaluation, providing a buffer for investors. The Forward P/E ratio stands at 33.59 compared to a TTM P/E of 50.74, indicating expectations for earnings growth. Historically, the P/E has ranged from 28.92 to 76.16 over the past decade, with a median of 49.85, positioning the current P/E as relatively high but not unprecedented. The TTM P/S ratio is 8.84, near its 10-year low, hinting at a potentially attractive entry point compared to historical norms.
O’s TTM EV/EBITDA is 17.39, which is slightly above its 10-year low of 15.80 but below the median of 20.16, suggesting the company is reasonably valued on an enterprise basis relative to its earnings. The TTM Price-to-Book ratio is 1.21, closer to its 10-year low of 1.12 and significantly below the median of 2.03, indicating a potential undervaluation in terms of book value. The TTM Price-to-Free-Cash-Flow is 13.07, leaning towards the lower end of its historical range, reinforcing the notion of a fair to undervalued status based on cash flow metrics.
Analysts have set a price target of approximately $63.03, slightly below the intrinsic value estimate but above the current trading price, supporting a positive outlook. While the number of price targets and analyst ratings remains steady, recent adjustments show a slight decrease in target prices over the past three months, reflecting cautious optimism. Overall, O appears to offer a margin of safety with room for growth, aligning with favorable intrinsic and analyst assessments despite some high valuation metrics.

Debt, Operating Margins, and Financial Risks for Realty Income
Realty Income Corp faces several financial risks that investors should carefully consider. The company has been increasing its debt load significantly, with $7.1 billion issued over the past three years, which could strain financial resources if not managed prudently. The rapid growth in total assets, at 34.5% per year, compared to a modest 5.1% revenue growth, suggests potential inefficiencies and raises concerns about asset utilization. Moreover, the declining operating margin, averaging a 4% decrease annually over five years, along with a high dividend payout ratio of 2.19, indicates possible sustainability issues for its dividend policy.
Additionally, the Altman Z-score of 0.96 places Realty Income Corp in the distress zone, pointing to a heightened risk of financial distress or bankruptcy. The data suggests that changes in government spending priorities, economic conditions, or the company’s bidding strategy could influence the variability in contract amounts. However, there are positive indicators such as a low Beneish M-Score, implying a low likelihood of earnings manipulation, and valuations at historical lows with a price-to-book ratio of 1.2 and a price-to-sales ratio of 8.69. Investors may find the high dividend yield appealing but should remain cautious given the financial risks highlighted.
Insider Selling and Institutional Ownership Trends in Realty Income
Over the past year, insider trading activity for O reveals a trend of consistent selling without any buying by the company’s directors and management. In the last 3 months, one insider sold shares, while no one recorded any purchases. This pattern extends back over the last 6 months with 3 insider sales and no purchases, and over the last 12 months with 4 sales and similarly no buys.
The lack of insider buying may indicate a lack of confidence in the company’s short-term stock performance or valuation by those most knowledgeable about the company. The fact that insider ownership stands at a mere 0.21% suggests limited alignment between insiders and shareholder interests, potentially reflecting a disinterest in acquiring more shares at current prices.
Meanwhile, institutional ownership is robust at 88.65%, indicating strong interest and investment by institutional players. However, the trend of insider selling could be a signal for investors to carefully consider the reasons behind insiders’ decisions to reduce their holdings.

Analyzing Realty Income’s Trading Volume and Dark Pool Activity
The current trading analysis of O shows a daily trading volume of 4,058,023 shares, which falls below its average daily trading volume over the past two months of 5,284,824 shares. This indicates a temporary dip in trading activity, suggesting either a lull in investor interest or external market factors influencing trading volumes.
The Dark Pool Index (DPI) for O stands at 48.79%, highlighting that nearly half of the trades occur off-exchange. This level of dark pool activity can imply that institutional investors are significantly involved in trading O, possibly seeking to minimize market impact and trading costs associated with large transactions. However, a high DPI also reduces transparency in trading, potentially leading to less price discovery in the public markets.
Overall, while O’s current trading volume is below its two-month average, the substantial dark pool activity indicates ongoing institutional interest. Investors should consider these factors when assessing O’s liquidity and market dynamics.
Impact of Government Contracts on Realty Income’s Revenue
Analyzing the government contracts for Company O over the specified years shows a fluctuating pattern in financial engagements. The data suggests that changes in government spending priorities, economic conditions, or the company’s bidding strategy could influence variability in contract amounts. This pattern emphasizes the importance of adaptive strategies in contract acquisition and management to maintain a stable revenue stream amidst such variability. Further analysis of market conditions and competitor activities could provide deeper insights.
Tracking Realty Income’s Patent Trends and Strategic Shifts
The data on U.S. all patents for Company O over a span of several years shows a fluctuating trend. With initial low numbers in the early years, there is a noticeable increase, peaking in the mid-period before tapering off towards the end. This suggests a period of intensive innovation and patent filing, likely driven by strategic R&D initiatives. However, the decline in later years might indicate a shift in focus or market strategy, warranting further investigation for underlying causes.
Senator Investments in Realty Income: Signals and Implications
Senator Gary Peters, a Democrat from the Senate, executed two significant financial transactions involving the purchase of stocks in the company identified by the ticker “O.” The most recent transaction occurred on March 14, 2023, with a reported value in the range of $15,001 to $50,000. The company filed this transaction on April 12, 2023. It made an earlier similar purchase on July 21, 2021, within the same transaction value range, and reported it on August 3, 2021.
Both transactions indicate a consistent investment strategy by Senator Peters in this particular stock over the span of two years. The choice to invest significant sums in the same company might suggest a positive outlook on its future performance or alignment with its financial interests and strategy. These transactions offer insights into the decision-making process and Senator Peters’s confidence levels regarding his investments.
Disclosures:
Yiannis Zourmpanos has a beneficial long position in the shares of O either through stock ownership, options, or other derivatives. This report has been generated by our stock research platform, Yiazou IQ, and is for educational purposes only. It does not constitute financial advice or recommendations.


