Dollar General stock forecast: 20,000+ Stores, Small Footprints, Big Rural Impact
With more than 20K locations, Dollar General’s (DG) banner is nearly ubiquitous across the rural United States. Dollar General serves as a convenient shopping destination for fill-in store trips, with its value proposition most relevant to consumers in small communities with a dearth of shopping options. The retailer operates a frugal store of about 7,500 square feet and primarily offers an assortment of branded and private-label consumable items (80% of net sales) such as paper and cleaning products, packaged and perishable food, and health and beauty items at low prices. Dollar General also offers a limited assortment of seasonal merchandise, home products, and apparel. The firm sells most items at a price point of $10 or less. DG stock is currently trading at ~$75. Let’s explore Dollar General stock forecast in more details.

DG Stock: EPS Trends, Sequential Gains but YoY Decline
In the latest quarter ending October 31, 2024, DG reported an EPS without NRI (excludes non-recurring items) of $0.89, reflecting a significant drop from $1.70 in the previous quarter (QoQ) and $1.26 from the same quarter last year (YoY). This decline in earnings is notable as it contrasts with the company’s 5-year CAGR of 7.60% and a more robust 10-year CAGR of 13.10% in annual EPS without NRI. Revenue per share was slightly down at $46.289 from $46.397 in the previous quarter, though up from $44.104 a year ago. Industry projections suggest a growth rate of approximately 3-4% over the next decade, indicating potential challenges for DG to maintain historical growth rates.
DG’s gross margin for the quarter stood at 29.61%, which is at the lowest point in the last decade, compared to the 10-year median of 30.81%. This margin compression could be affecting profitability, alongside the absence of share buybacks this year. Historically, DG has engaged in share repurchases, with a 10-year buyback ratio of 3.70%, enhancing EPS by reducing the number of shares outstanding. However, without recent buybacks, the diluted EPS reflects the full impact of reduced earnings.
Looking ahead, analysts project DG’s revenue to grow to $40,568.31 million in fiscal 2025, increasing to $44,196.09 million by 2027. Estimated EPS for the next fiscal year stands at 5.746, suggesting moderate growth. The next earnings announcement is expected on March 14, 2025, which will provide further clarity on DG’s performance and strategic direction. These figures indicate that while growth continues, it may be at a more tempered pace, especially given current margin pressures and the absence of recent share repurchases.

ROIC vs. WACC: DG’s Diminished Value Creation Spread
DG has demonstrated a capability to generate economic value over the past five years, as evidenced by its median Return on Invested Capital (ROIC) of 11.83%, which surpasses its median Weighted Average Cost of Capital (WACC) of 4.05%. This indicates that DG has been efficiently using its capital to generate returns exceeding its cost of capital, thus creating shareholder value.
However, recent performance suggests a decline in this value creation capability, with the current ROIC at 6.03%, close to the 10-year low and only marginally above the current WACC of 3.73%. This narrowing spread between ROIC and WACC highlights a potential concern for sustained economic value generation.
The variability in ROIC, ranging from a high of 16.47% over the past decade to the current low, suggests potential volatility in operational efficiency or market conditions. Nonetheless, DG’s historical ability to maintain ROIC above WACC indicates a generally strong performance, though recent trends warrant close monitoring to ensure ongoing capital efficiency and value creation.

Dividend Growth Slows Amid Debt Concerns
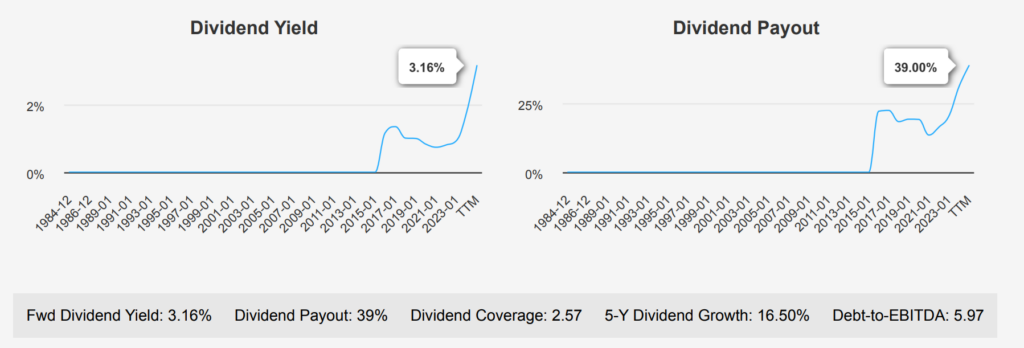
DG has demonstrated a robust dividend growth history, with a 5- year growth rate of 16.50% and a slightly higher 3-year rate of 17.90%. This indicates a consistent commitment to increasing shareholder returns. However, the forecasted dividend growth rate over the next 3-5 years may be only 1.87%, suggesting a potential slowdown under Dollar General stock forecast.

The latest dividend per share is consistent at $0.59, as noted in recent payments, reflecting a steady payout pattern. The forward dividend yield stands at 3.16%, which is quite competitive within the sector, particularly given a historical median yield of 0.99%.
DG’s Debt-to-EBITDA ratio is 5.97, which is significantly above the general guideline of 4.0, indicating elevated financial risk. This high leverage could be a factor limiting future dividend growth, as it raises concerns about debt servicing capabilities.
The dividend payout ratio is relatively low at 39.0%, providing some buffer for maintaining dividends even if earnings fluctuate. The next ex-dividend date is scheduled for January 7, 2025 (then April 7), based on a quarterly dividend frequency. This reflects a predictable and shareholder-friendly timetable for dividend distribution.

DG’s Valuation Metrics Suggest 67.8% Upside Potential
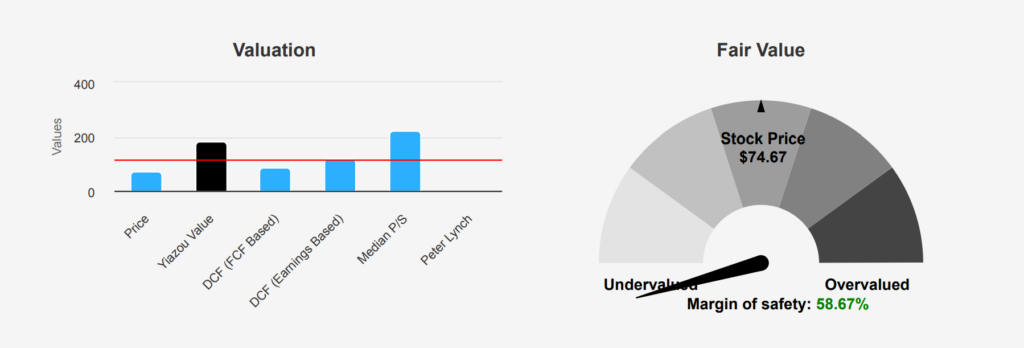
DG’s intrinsic value of $180.67 significantly exceeds its current price of $74.67, reflecting a substantial margin of safety of 58.67%. This suggests that DG is undervalued, offering a potential buffer for investors. The Forward P/E ratio is 12.57, close to its TTM P/E of 12.3, indicating stability in expected earnings. Compared to its 10-year median P/E of 19.93, DG appears undervalued. The TTM P/S ratio at 0.41 lies at its historical low, suggesting potential undervaluation relative to sales.
The TTM EV/EBITDA of 11.45 is below the 10-year median of 13.18, indicating a favorable valuation compared to its historical performance. Its TTM Price-to-Book ratio stands at 2.23, at the lowest point in its 10-year range, further highlighting potential undervaluation. Notably, the TTM Price-to-Free-Cash-Flow ratio of 9.97 is at its historical low, which is a positive indicator of the company’s ability to generate cash relative to its price, suggesting a strong valuation position under the Dollar General stock forecast.
Analyst ratings remain stable, with a price target decrease from $100.37 three months ago to $89.55 currently. Despite this downward trend in price targets, the significant margin between intrinsic value and current price indicates a compelling investment opportunity, assuming DG can maintain or improve its operational performance. Overall, DG’s current metrics suggest a potentially undervalued position, offering a reasonable margin of safety for investors.

High Debt Levels and Low Multiples: DG’s Risk-Reward Profile
Dollar General Corp currently faces several financial risks that investors should consider. The company’s long-term debt issuance of $2.1 billion over the past three years is notable, although it remains at an acceptable level. However, the poor track record of share buybacks, with the stock trading 67.6% below the average buyback price, raises concerns about capital allocation efficiency. Additionally, the growth in total assets at 15.4% annually, outpacing revenue growth of 13.4%, suggests potential inefficiencies. The declining operating margin, at an average annual rate of -3.6% over five years, and recent insider selling without any buying further highlight potential challenges under the Dollar General stock forecast.
On the positive side under Dollar General stock forecast, the company maintains a strong position against earnings manipulation risks, as indicated by a Beneish M-Score of -3.12. The stock’s valuation metrics, such as the PB ratio of 2.26, PE ratio of 12.46, and PS ratio of 0.41, are near historical lows, suggesting potential undervaluation. The dividend yield reaching a near 10-year high could also attract income-focused investors. Nevertheless, the Altman Z-score of 2.09 places the company in a grey area, indicating some financial stress, but not immediate bankruptcy risk.
DG Stock: Balanced Insider Actions with 93.97% Institutional Ownership
The insider trading activity for DG over the past year shows a discernible selling trend among the company’s directors and management. In the past 3 months, there were no insider purchases and 2 sales recorded. Extending the view to 6 months, there were 2 purchases and 4 sales, indicating twice as much selling activity as buying. From a 12-month perspective, the pattern remains consistent, with 2 purchases against 6 sales, pointing towards a continued preference for selling.
This trend might suggest that insiders are capitalizing on their holdings, possibly reflecting their outlook on the company’s near-term performance or valuation. Despite this selling trend, insider ownership stands at 5.20%, which is relatively modest. On the other hand, institutional ownership is significantly high at 99.64%, suggesting strong confidence from institutional investors. This could offset concerns from the insider selling trend, as institutional investors typically conduct rigorous assessments before maintaining such high levels of ownership. However, potential investors should still consider the implications of insider sales alongside other fundamental and market factors under the Dollar General stock forecast.

Dark Pool Activity at 34% Hints at Institutional Moves
DG shows a recent daily trading volume of 3,117,982 shares, which is lower than its two-month average daily trade volume of 4,150,223 shares. This suggests a potential decrease in trading activity or investor interest in the short term.
The Dark Pool Index (DPI) for DG stands at 57.58%. This indicates that a significant portion of its trades are executed in dark pools, suggesting that institutional investors might be actively engaging in off-exchange trading for DG. A DPI over 50% typically suggests heavy institutional involvement, which can influence the stock’s liquidity and price stability under the Dollar General stock forecast.
Overall, while DG’s current trading volume is below its recent average, the high DPI percentage hints at robust institutional interest, which might stabilize the stock despite lower public trading activity. Investors should consider how this institutional participation might affect liquidity and trading conditions, potentially leading to less volatility if large trades are executed away from public exchanges.
Conflicting Trades: What Congressional Moves Indicate About DG Stock
In recent congressional trading activities, Representative John James, a Republican from the House of Representatives, reported selling shares of Dollar General (Ticker: DG) on June 3, 2024. The transaction was valued in the range of $1,001 to $15,000 and was reported on September 2, 2024. This sale could indicate a shift in his portfolio strategy or a response to market conditions surrounding Dollar General at that time.
Earlier in the year, another Republican Representative, Dan Newhouse, also from the House, bought shares of Dollar General on April 10, 2024, for the same value range of $1,001 to $15,000. This purchase was reported on April 25, 2024. Newhouse’s acquisition might suggest confidence in Dollar General’s potential performance or an investment in its long-term growth.
The transactions suggest differing short-term perspectives on Dollar General’s market prospects within the same political party, possibly reflecting individual financial strategies or broader economic expectations.
Disclosures:
On the date of publication, Yiannis Zourmpanos did not hold (either directly or indirectly) any positions in the securities mentioned in this article. This report has been generated by our stock research platform, Yiazou IQ, and is for educational purposes only. It does not constitute financial advice or recommendations.


