Microsoft Stock: Edging on Segment Revenues and Key Offerings
Microsoft develops and licenses consumer and enterprise software. It is known for its Windows operating systems and Office productivity suite. The company is organized into three equally sized broad segments: productivity and business processes (legacy Microsoft Office, cloud-based Office 365, Exchange, SharePoint, Skype, LinkedIn, Dynamics), intelligence cloud (infrastructure- and platform-as-a-service offerings Azure, Windows Server OS, SQL Server), and more personal computing (Windows Client, Xbox, Bing search, display advertising, and Surface laptops, tablets, and desktops). MSFT stock is currently trading at ~$418. Discover more on Microsoft stock forecast 2025.

Microsoft’s Earnings & Growth: 2024 Performance and 2025 Forecast
Microsoft recently reported its earnings for the quarter ending September 30, 2024, revealing an EPS without non-recurring items (NRI) of $3.267. This marks an increase from the previous quarter’s $2.95 and a significant rise compared to the same quarter last year at $3.003. The company’s revenue per share also saw an uptick to $8.78 from $8.659 in the prior quarter and $7.574 year-over-year. Over the past five years, Microsoft’s EPS without NRI has experienced a robust Compound Annual Growth Rate (CAGR) of 19.70%, with a slightly lower 10-year CAGR of 19.50%. The technology industry projects a growth of about 10% annually over the next decade, aligning with Microsoft’s strong performance trajectory.
Microsoft’s gross margin for the quarter stood at 69.35%, slightly above its five-year median of 68.92% and close to its 10-year high of 69.76%. The company’s share buyback activity showcased a slight reduction over the past year with a buyback ratio of -0.10%, implying a net issuance of shares. However, over the longer term, Microsoft has maintained a steady buyback strategy with a 10-year buyback ratio of 0.90%, effectively repurchasing 0.90% of its shares annually. This strategy has contributed positively to EPS growth by reducing the total number of shares outstanding and enhancing shareholder value.
Looking ahead, analysts forecast Microsoft’s EPS to reach approximately $13.03 in the next fiscal year and $14.95 in the subsequent year, indicating continued growth. Revenue projections also show an upward trajectory, with estimates of $278.4 billion for 2025, $317.6 billion for 2026, and $363.7 billion for 2027. These expectations signal a positive outlook for Microsoft as it continues to capitalize on industry growth trends. Investors can anticipate the next earnings report on January 30, 2025, which will shed more light on the company’s performance and strategic direction under Microsoft stock forecast 2025.

Microsoft’s Financial Performance: ROIC and Operational Efficiency
Microsoft’s financial performance highlights significant value creation, as evidenced by its Return on Invested Capital (ROIC) consistently exceeding its Weighted Average Cost of Capital (WACC). Over the last five years, the median ROIC stands at 25.83%, while the median WACC is 8.09%. This indicates that Microsoft is generating considerable economic profit and efficiently utilizing its capital to create shareholder value.
Currently, Microsoft’s ROIC is 22.07%, which is still well above the current WACC of 9.90%. This positive spread underscores Microsoft’s capability to generate returns significantly greater than the cost of its capital, a key indicator of financial health and operational efficiency.
Furthermore, with a 5-year median Return on Assets (ROA) of 19.07% and a Return on Equity (ROE) of 35.68%, Microsoft demonstrates robust profitability and effective management. The company’s strategic capital allocation, reflected in its high ROIC figures, ensures sustained value creation under Microsoft stock forecast 2025, reinforcing its position as a strong performer in the technology sector.

Dividend Growth Outlook: 10% Annual Rate with Low Payout Ratio
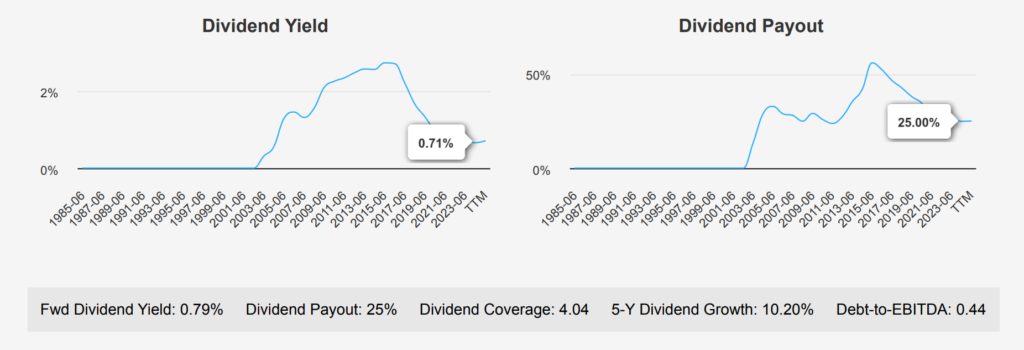
Microsoft stock has demonstrated consistent dividend growth over the past five years, with a compound annual growth rate of 10.20%. The recent quarterly dividend increase to $0.83 per share from $0.75 reflects this ongoing growth trend. The company’s forward dividend yield stands at 0.79%, which is relatively low compared to its historical median of 1.27%. This lower yield often indicates a rapidly appreciating stock price, which can outpace dividend growth.

In terms of financial health, MSFT maintains a very low debt-toEBITDA ratio of 0.44, indicating a strong capacity to manage its debt obligations. This ratio is well below the general threshold of 2.0, signifying minimal financial risk. The dividend payout ratio is currently at 25.0%, providing ample room for future dividend increases, as it remains significantly lower than historical highs.
Looking ahead, the estimated dividend growth rate over the next 3-5 years is 10.18%, suggesting a continuation of robust growth. The next ex-dividend date is on February 19, 2025, based on the quarterly frequency, ensuring it falls on a weekday and aligns with the company’s consistent dividend schedule.

Microsoft’s Valuation in 2025: Intrinsic Value vs. Market Price
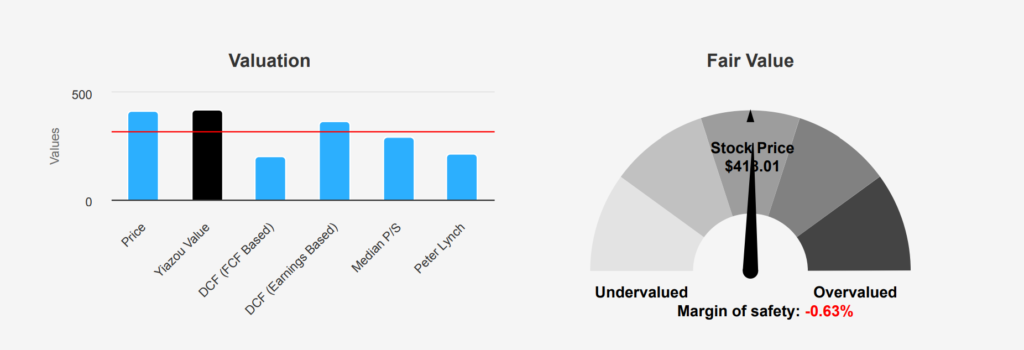
Microsoft’s current valuation suggests it is trading slightly above its intrinsic value of $415.34, with a current price of $418.01, representing a marginal negative margin of safety of -0.64%. This indicates that the stock does not currently offer a price buffer for investors seeking a discount to intrinsic value. The Forward P/E ratio of 32.11 is slightly above its 10-year median of 31.69, implying a moderate premium compared to historical norms. The TTM P/E ratio of 34.49 is well positioned between the 10-year high and low, hinting at a reasonable valuation given its historical context.
Microsoft’s TTM EV/EBITDA of 22.4, while elevated compared to its 10-year median of 17.40, is still below the 10-year high of 28.08, suggesting some room for growth but also indicating potential overvaluation. The TTM Price-to-Free-Cash-Flow ratio stands at 42.97, significantly above the 10-year median of 28.58, further supporting the notion of a premium valuation. The TTM Price-to-Sales ratio of 12.28, although above the median, is consistent with the company’s robust revenue growth expectations.
Analyst sentiment remains positive, with the price target gradually increasing over recent months, currently at $497.60, reflecting confidence in Microsoft’s growth prospects. Despite the high valuations, the company’s strong market position and growth potential offer a compelling case for long-term investors, albeit with a careful consideration of the current premium pricing.

Risk & Reward Analysis: Financial Health, Insider Trading Trends
Microsoft Corp (MSFT) exhibits both promising and cautionary signals in its current financial standing. On the positive side, the company demonstrates robust financial health, highlighted by an Altman Z-score of 9.8, indicating a low risk of bankruptcy. The Beneish M-Score of -2.35 suggests a low likelihood of earnings manipulation. Furthermore, the company’s expanding operating margin and predictable revenue growth suggest operational efficiency and stability. The price-to-book (PB) and price-to-earnings (PE) ratios being near their one-year lows suggest potential undervaluation relative to historical metrics.
However, caution is warranted due to a few concerning indicators. The rapid growth in total assets at 23.2% per year compared to a 15.2% revenue growth rate over the past five years may indicate decreasing efficiency in asset utilization. Insider selling activity, with six transactions amounting to 190,629 shares sold in the last three months and no insider buying, could signal a lack of confidence among those closest to the company’s operations. Additionally, with the stock price near a 10-year high, investors should be wary of potential overvaluation risks. Balancing these factors, prospective investors should carefully consider Microsoft’s growth strategy and market conditions under Microsoft stock forecast 2025.
Insider Activity: Recent Trends in Microsoft Director Stock Sales
Recent insider trading activity for Microsoft (MSFT) reveals a clear trend of selling among the company’s directors and management. Over the past three months, there have been zero insider purchases and six insider sales. This pattern continues when examining a longer period; in the last six months, there were no buys and eight sales, and in the past year, no buys have been recorded against 14 sales. This persistent selling trend may suggest that insiders are capitalizing on the stock’s performance or reallocating their personal portfolios.
Despite these sales, it’s essential to consider the broader ownership context. Insider ownership stands at 6.18%, indicating that management and directors hold a significant stake in the company. Additionally, institutional ownership is high at 73.48%, reflecting strong confidence from large investors. While insider sales are noteworthy, they do not necessarily signal a loss of confidence in the company’s future. Investors should consider these sales alongside other factors, such as the company’s financial performance and market conditions, before drawing conclusions.

Microsoft Stock Liquidity: Trading Volume and Dark Pool Insights
Microsoft Corporation (MSFT) demonstrates a robust liquidity profile in the current market environment. The daily trading volume stands at 19,830,227 shares, slightly above the average two-month trading volume of 19,395,490 shares. This indicates a healthy level of interest and active participation in the stock, allowing for efficient buying and selling with minimal impact on the stock’s price.
The Dark Pool Index (DPI) for MSFT is 21.87%. A DPI of this level suggests that a significant portion of MSFT trades occur in dark pools, which are private exchanges that are not available to the public. These trades can indicate the presence of institutional investors who are executing large orders without affecting the stock’s market price. A DPI in this range typically reflects a balanced flow between institutional and retail investors, promoting stable price movements.
Overall, MSFT’s liquidity metrics suggest that the stock is well-positioned to handle large transactions without experiencing excessive volatility. This makes it an attractive option for both retail and institutional investors looking for a stable and liquid investment vehicle in the tech sector.
Congress Trades Microsoft Stock: Bipartisan Interest in 2024
In late October 2024, two members of the U.S. House of Representatives made significant purchases of Microsoft (MSFT) stock, indicating potential confidence in the company’s future performance. On October 31, 2024, Representative William R. Keating, a Democrat, reported a purchase valued between $1,001 and $15,000. Just a few days earlier, on October 21, 2024, Representative Marjorie Taylor Greene, a Republican, also reported buying Microsoft shares within the same value range. These transactions suggest a bipartisan interest in Microsoft, likely driven by its strong market position and potential growth prospects.
Under Microsoft stock forecast 2025, the timing of these trades, close to the company’s earnings report or strategic announcements, could reflect expectations of favorable company performance or market conditions. Such bipartisan activity in the stock market highlights the widespread appeal of tech stocks as stable investment opportunities among legislators.
Disclosures:
Yiannis Zourmpanos has a beneficial long position in the shares of MSFT either through stock ownership, options, or other derivatives. This report has been generated by our stock research platform, Yiazou IQ, and is for educational purposes only. It does not constitute financial advice or recommendations.


