Ford’s Market Position and Brand Strategy in 2025
Ford (F) manufactures automobiles under the Ford and Lincoln brands. In March 2022, the company announced that it would run its combustion engine business, Ford Blue, and its BEV business, Ford Model E, as separate businesses but still all under Ford Motor. The company has nearly 13% market share in the United States, about 11% share in the UK, and under 2% share in China, including unconsolidated affiliates. Sales in the US made up about 66% of 2023 total company revenue. Ford has about 177,000 employees, including about 59,000 UAW employees, and is based in Dearborn, Michigan. F stock is currently trading near $10.3. Lets explore Ford stock forecast 2025.

Q3 2024 Earnings and Ford stock’s Long-Term Growth Projections
In the third quarter ending September 2024, Ford reported an EPS without non-recurring items (EPS without NRI) of $0.49, consistent with the first quarter but slightly up from $0.47 in the second
quarter. This marks an improvement from last year’s quarter when the EPS without NRI was $0.39. The company’s 5-year Compound Annual Growth Rate (CAGR) for annual EPS without NRI stands at 15.70%, though it shows a decline over the longer 10-year period with a CAGR of -4.10%. Overall, the automotive industry projects a growth rate of around 3-4% over the next decade, aligning with broader market trends.
Ford’s gross margin for the quarter was 7.68%, which is below the 5-year median of 9.17% and significantly lower than the 10-year high of 12.06%. This reduction in margin could indicate rising costs or pricing pressures in the market. The company’s share buyback activities reflect a nuanced strategy, with a 1-year buyback ratio of 0.70%. This means 0.7% of the total shares were repurchased over the past year. This buyback ratio, seen as a positive move, can enhance EPS by reducing the number of shares outstanding.
Looking ahead, Ford’s EPS may reach 1.481 for the fiscal year ending in 2025 and 1.758 by the end of 2026, suggesting optimism among analysts about future performance. Revenue estimates for the upcoming years indicate a steady trajectory, with figures hovering around $170 billion. The next earnings report is on February 6, 2025, which should provide further insights into Ford stock forecast 2025 and whether these positive trends will continue.

Ford’s ROIC vs. WACC Performance
Ford’s financial performance analysis reveals that its Return on Invested Capital (ROIC) consistently falls below its Weighted Average Cost of Capital (WACC). The five-year median ROIC is 2.07%, which is significantly lower than the five-year median WACC of 3.96%. The current ROIC is at 1.89%, while the present WACC is 4.17%. This indicates that Ford is not generating sufficient returns on its invested capital to cover its cost of capital, suggesting inefficiencies in capital allocation and a lack of economic value creation under Ford stock forecast 2025.
A positive spread between ROIC and WACC would imply value generation for Ford’s shareholders, but the negative spread here suggests the opposite. Over the past decade, ROIC has never exceeded WACC, highlighting a persistent challenge in creating shareholder value. This underperformance calls for a strategic reassessment of investment decisions and operational efficiencies to enhance ROIC, aiming to surpass the WACC and improve overall financial health and shareholder returns.

Dividend Stability and Growth Potential Amid High Debt Levels
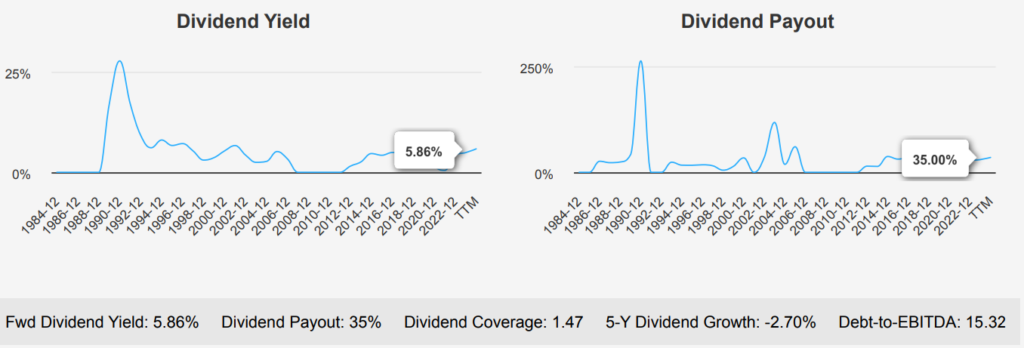
Ford has shown a mixed dividend growth performance over recent years, with a 5-year dividend growth rate of -2.70% yet a dramatic 3-year growth rate of 58.70%. The most recent quarterly dividend was $0.15 per share, consistent with previous quarters, suggesting stability but not growth in payouts. This is reflective of a conservative dividend payout ratio of 35.0%, significantly lower than its historical highs over the past decade, indicating room for potential increases. The forward dividend yield stands at 5.86%, attractive relative to the sector’s median yield of 4.88%.

Looking ahead, the company may grow dividends at an estimated rate of 5.54% over the next 3-5 years, suggesting a strategic focus on sustainable growth. However, the high Debt-to-EBITDA ratio of 15.32 is a concern, indicating significant financial leverage and potential risk in servicing debt, particularly in a volatile market environment. This ratio is well above the cautionary threshold of 4.0, highlighting the importance of monitoring Ford’s debt management strategies. The next ex-dividend date is February 7, 2025, given the quarterly frequency and the latest ex-dividend date of November 7, 2024. Investors should consider these factors when evaluating Ford stock forecast 2025 and dividend prospects.

Ford Stock’s Intrinsic Value vs. Market Price in 2025
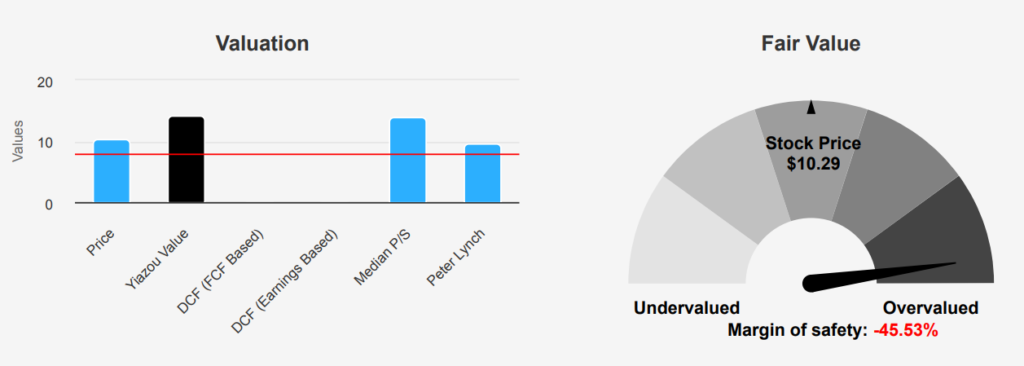
The current intrinsic value of Ford (F) stands at $7.07, whereas its market price is $10.29, indicating a negative margin of safety of -45.54%. This suggests that the stock may be overvalued relative to its intrinsic value. The forward P/E ratio is 5.54, significantly lower than the trailing twelve-month (TTM) ratio of 11.69 and well below the 10-year median of 11.35. This could imply expectations of improved earnings or a potential undervaluation based on future earnings. The TTM P/S ratio is 0.23, which is closer to the lower end of its 10-year range, signaling a potentially attractive valuation from a sales perspective.
Ford’s TTM EV/EBITDA ratio is 15.77, aligning with its 10-year median of 15.69, which might suggest that the stock is fairly valued based on this metric. However, the TTM Price-to-Free-Cash-Flow ratio is 6.41, above the 10-year median of 4.46, indicating a premium or possibly a reflection of higher free cash flow stability or growth. The TTM P/B ratio at 0.92 is below the 10-year median of 1.28, positioning the stock as potentially undervalued concerning its book value.

The analyst sentiments have gradually adjusted downward, with the price target decreasing from $13.17 three months ago to $11.97 currently. This trend could reflect changing market conditions or company-specific challenges. While the stock demonstrates some valuation attractiveness through its P/S and P/B ratios, the negative margin of safety and declining price targets suggest caution. Potential investors
might consider waiting for a more favorable valuation or further clarity on Ford stock forecast 2025.
Key Risks to Watch: Debt, ROIC, and Bankruptcy Indicators
Ford’s financial landscape presents several risk factors that potential investors should consider. The company’s issuance of $12.5 billion in debt over the past three years indicates a significant reliance on borrowing, which could increase financial vulnerability, especially if not matched with corresponding revenue growth. The occasional operating income loss further raises concerns about the company’s ability to generate profits consistently.
Additionally, the company’s return on invested capital (ROIC) is below its weighted average cost of capital (WACC), suggesting inefficiencies in capital utilization, potentially hindering long-term growth prospects. The Altman Z-score of 1.01 places Ford in the distress zone, flagging a heightened risk of bankruptcy within two years.
On a positive note, Ford’s Beneish M-Score of -2.31 indicates a low probability of financial statement manipulation, suggesting transparency in financial reporting. The company’s price-to-book (PB) and price-to-sales (PS) ratios are close to their three-year lows, possibly offering a value proposition for investors looking for undervalued stocks. Moreover, the dividend yield is near a three-year high, potentially providing attractive income for investors. While these positives may appeal to certain investors, the overarching financial risks necessitate a cautious approach.
F Stock’s Insider Trading Patterns and Institutional Ownership
The insider trading activity for Ford stock over the past year shows minimal movement among the company’s directors and management. Over the last three months, there have been no insider buys or sells, indicating a period of stability or potential uncertainty in the company’s future prospects. In the
broader six-month period, there was one insider buy and one insider sell, suggesting a balanced perspective on the company’s valuation or future performance among insiders.
Analyzing the past 12 months, there were two insider buys and two insider sells, maintaining a consistent pattern of cautious trading behavior. This balanced activity could indicate that insiders are not highly optimistic or pessimistic about the company’s immediate future.
Insider ownership stands at a modest 0.95%, which suggests limited direct influence from insiders on the company’s stock. Institutional ownership is significantly higher at 59.06%, highlighting that institutional investors have a substantial stake and potentially more influence over market perceptions and stock movements. This ownership structure could imply a reliance on institutional confidence to drive the company’s stock performance.

High Liquidity Trends and Dark Pool Activity
The liquidity and trading analysis for Ford indicates a robust trading environment. The most recent trading day recorded a volume of 69,610,736 shares, which significantly exceeds the average daily trade volume over the past two months of 50,686,904 shares. This suggests heightened investor interest or activity, potentially driven by news or market trends impacting Ford.
The Dark Pool Index (DPI) stands at 44.85%, which implies that a substantial portion of Ford’s trading volume is executed in dark pools. This high DPI percentage suggests that significant trading activity is occurring away from public exchanges, potentially indicating institutional interest or strategic trading by large investors.
Overall, the data suggests that Ford is experiencing strong liquidity with its substantial trading volumes, ensuring ease of transaction execution with minimal price impact. The elevated DPI also points to increased institutional involvement, which could influence stock price movements depending on the strategic objectives of these traders. Investors should consider these factors when assessing Ford’s stock for potential investment opportunities or risks.
Government Contracts in 2024: A Strategic Advantage?
Ford’s government contract figures show fluctuations over the years, with a notable peak in 2022 at $704 million. This suggests a significant project or increased demand during that period. The subsequent drop in 2023 to $320 million indicates potential completion or reduction in contract size. The anticipated rise in 2024 to $583 million suggests renewed or expanded contracts. These variations highlight Ford’s responsiveness to government needs and strategic planning in securing contracts.
Congressional Transactions: Recent Trades on Ford Stock
In recent Congressional trading, two noteworthy transactions involving Ford (F) stock were reported. On August 16, 2023, Representative Earl Blumenauer, a Democrat from the House, executed a sale of Ford shares valued between $15,001 and $50,000. This transaction was reported on September 6, 2023.
Just a couple of days earlier, on August 14, 2023, Senator Tommy Tuberville, a Republican, made a purchase of Ford shares, with the transaction falling in the $1,001 to $15,000 range, and this was reported on September 15, 2023. These trades highlight differing strategies among lawmakers, with Representative Blumenauer opting to liquidate Ford holdings while Senator Tuberville increased his position.
Such trades can reflect personal financial strategies or perceptions of Ford’s future performance. Given the timing and the parties involved, these transactions might also indicate different economic outlooks or investment strategies within the two political parties.
Disclosures:
On the date of publication, Yiannis Zourmpanos did not hold (either directly or indirectly) any positions in the securities mentioned in this article. This report has been generated by our stock research platform, Yiazou IQ, and is for educational purposes only. It does not constitute financial advice or recommendations.


