


Procter & Gamble Stock: Own A Global Consumer Products Powerhouse
Since its founding in 1837, Procter & Gamble (PG) has become one of the world’s largest consumer product manufacturers. It is generating more than $80 billion in annual sales. It operates with a lineup of leading brands, including more than 20 that generate north of $1 billion each in annual global sales, such as Tide laundry detergent, Charmin toilet paper, Pantene shampoo, and Pampers diapers. Sales outside its home turf represent more than half of the firm’s consolidated total. Procter and Gamble stock is currently trading near $117.
Steady Growth, Strong Margins, Promising Future
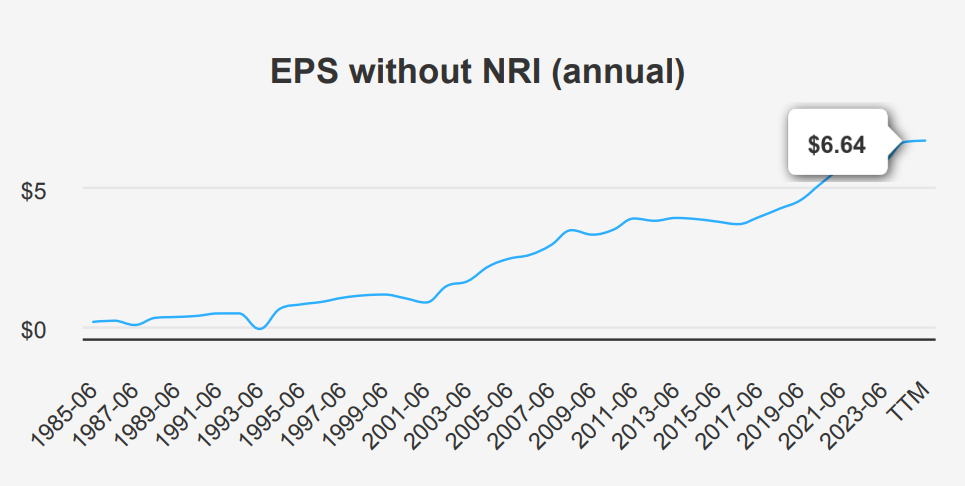
In the latest quarter ending June 30, 2024, Procter & Gamble reported an EPS without non-recurring items (EPS without NRI) of $1.45, down from $1.52 in the previous quarter but up from $1.37 in the same quarter last year. The EPS (Diluted), including all potential shares that could be created through converting convertible securities, was $1.27. The revenue per share was $8.305, slightly higher than the $8.296 recorded a year prior. Over the past five years, the company has achieved a Compound Annual Growth Rate (CAGR) of 6.90% for annual EPS without NRI, with a slightly lower 10-year CAGR of 6.40%
PG’s gross margin reached a 10-year high of 51.39%, significantly above its 10-year median of 49.12%, reflecting strong operational efficiency. The company’s strategic share buyback program has also influenced its earnings per share by reducing the number of outstanding shares. Over the past year, PG repurchased 0.20% of its shares, contributing to a 10-year buyback ratio of 1.50%. This buyback activity boosts EPS by decreasing the share count and enhancing shareholder value. Industry forecasts suggest a moderate growth rate over the next decade, with the consumer goods sector expected to grow at a steady pace.
Looking ahead, analysts project PG’s revenue to reach $93,106.39 million by 2027, with EPS estimates of $6.940 for the fiscal year ending 2025 and $7.421 for 2026. This positive outlook is supported by continued innovation and market expansion strategies. The next earnings release is scheduled for October 18, 2024, where further insights into the company’s performance will be provided.
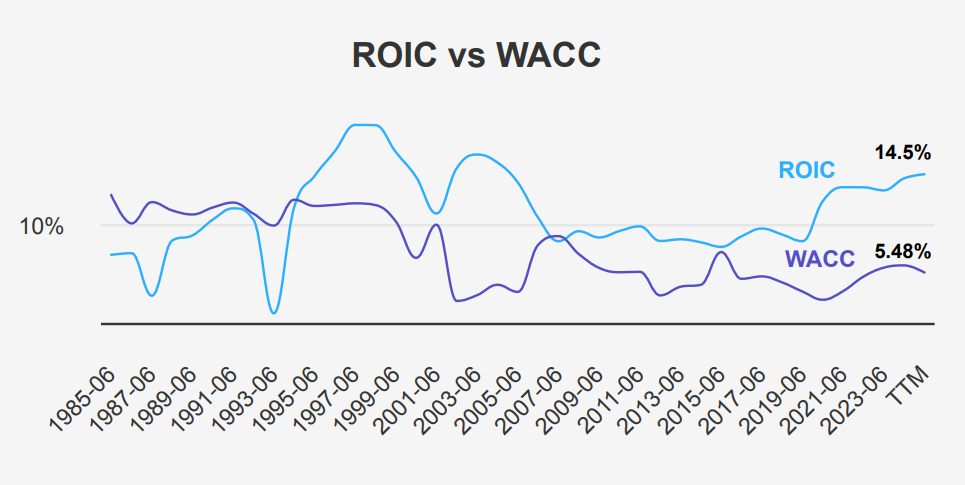
Procter & Gamble’s Strong Returns Outpace Capital Costs
Procter & Gamble’s financial performance indicates strong economic value creation, primarily through its efficient capital allocation. The company’s Return on Invested Capital (ROIC) stands at 14.50%, significantly higher than the Weighted Average Cost of Capital (WACC) of 5.48%. This substantial spread between ROIC and WACC demonstrates that PG generates considerable positive value for its shareholders. PG earns more on its investments than the cost of capital required to fund them.
Over the past five years, PG’s median ROIC was 13.30%. This is consistently surpassing its WACC, which had a median of 5.11% over the same period. This recurring performance suggests a robust ability to maintain efficient use of its capital. Moreover, PG’s Return on Equity (ROE) is also impressive, with a current figure of 30.57% and a five-year median of 30.80%. This reflects effective management and profitability relative to shareholder equity.
Overall, PG’s performance metrics illustrate a well-managed company that not only covers its cost of capital but also generates significant additional value, underscored by its status as a financially efficient enterprise.
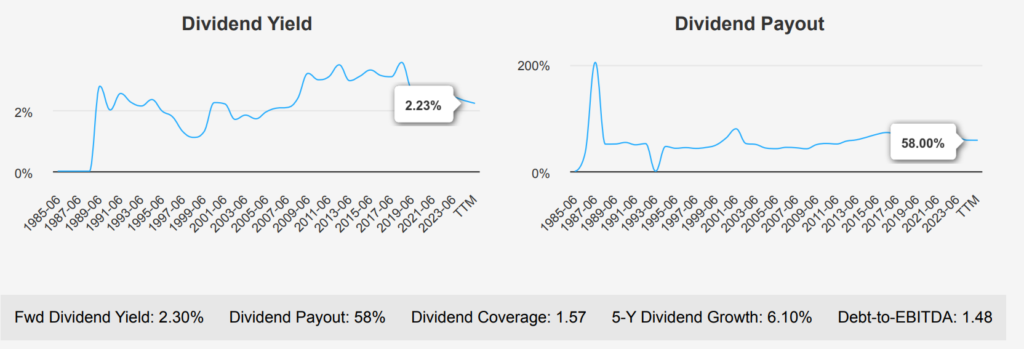
Procter & Gamble: Reliable Dividend Growth, Sustainable Future
Procter & Gamble has demonstrated consistent dividend growth, with a 5-year growth rate of 6.10% and a slightly lower 3- year growth rate of 5.70%. The most recent quarterly dividend raised the per share payout to $1.0065, continuing the trend of incremental increases. The company’s forward dividend yield stands at 2.30%, slightly below the 10-year median of 2.61%, yet comfortably above the 10-year low of 2.07%.
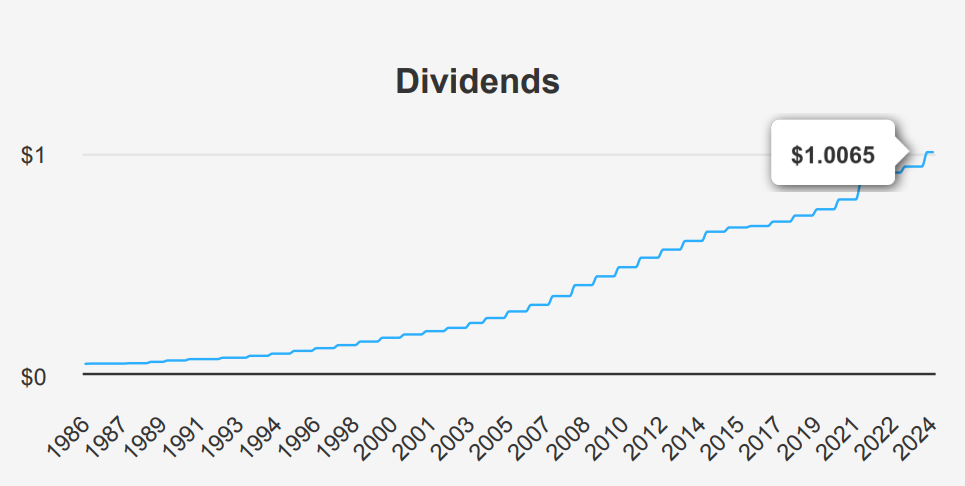
The Debt-to-EBITDA ratio for PG is 1.48, which indicates a strong debt-servicing capacity and low financial risk, especially compared to the industry guideline of less than 2.0 for low-risk profiles. This solid financial health supports their ability to sustain and grow dividends.
PG’s dividend payout ratio is currently at 58%, a significant decrease from the historical highs over the past decade, suggesting a more sustainable dividend policy. Looking ahead, the future 3-5 year dividend growth rate is estimated at 4.77%. This indicates continued positive growth, albeit at a slightly slower pace.
The next ex-dividend date is predicted to be October 18, 2024, aligning with the historical quarterly schedule. PG’s dividend strategy remains robust, reflecting its stable financial position and commitment to returning value to shareholders.
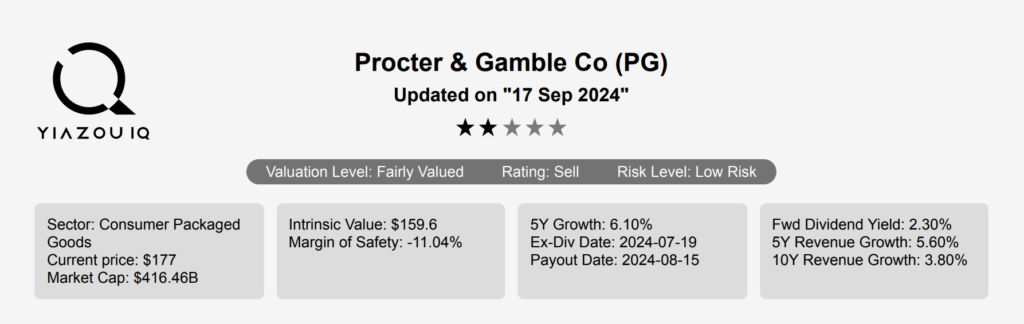
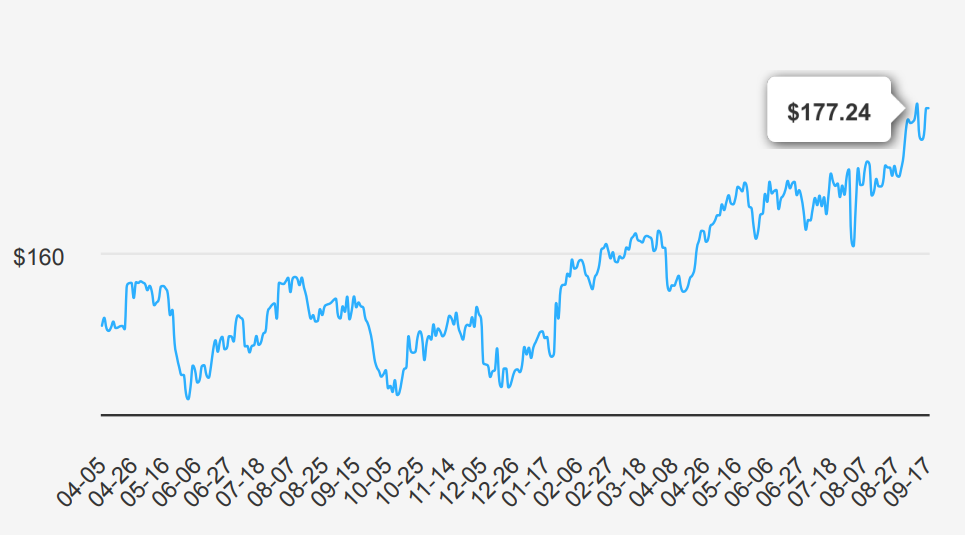
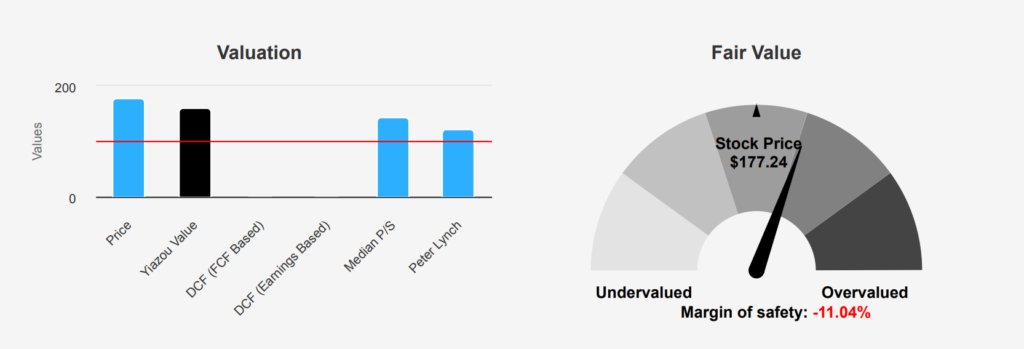
Procter & Gamble’s Overvaluation: Navigating High Price Risks
Procter & Gamble stock is currently trading at $177.24. This is above its calculated intrinsic value of $159.6, indicating a negative margin of safety of 11.05%. This suggests that the stock is overvalued relative to its intrinsic worth. The company’s TTM P/E ratio stands at 29.44, slightly above its 10-year median of 25.45 but well below the 10-year high of 91.60. It indicates a valuation that is high in the historical context but not unprecedented. The forward P/E ratio of 25.41 suggests some expected earnings growth. Yet it still indicates a premium compared to historical medians.
The TTM EV/EBITDA ratio is 19.21, which is just above the 10-year median of 17.45. This suggests the company is valued similarly to its historical average when considering earnings before interest, taxes, depreciation, and amortization. However, the TTM Price-to-Book ratio of 8.44 is significantly above the 10-year median of 6.34. This highlights an elevated valuation level that could signal overvaluation. Additionally, the TTM Price-to-Free-Cash-Flow ratio of 26.51 is above its 10-year median of 24.00, indicating the market is pricing in relatively strong future free cash flow performance.
Analyst ratings and price targets suggest a stable outlook for PG, with a price target of $176.48, slightly below the current trading price. The gradual increase in price targets over recent months indicates moderate positive sentiment among analysts. However, given the negative margin of safety and current valuation metrics that exceed historical norms. Investors should carefully consider whether the potential for premium future growth justifies the present valuation. The current prices may not provide a significant buffer against market volatility or downturns.
Strong Financials, Hidden Risks Loom
Procter & Gamble demonstrates a solid financial foundation, as evidenced by its strong Altman Z-score of 5.96, suggesting a low likelihood of bankruptcy. Additionally, the company’s Beneish M-Score of -2.59 indicates minimal risk of financial manipulation, reinforcing its stable financial reporting practices. The expanding operating margin further suggests operational efficiency and potential profitability growth, presenting a favorable outlook from an operational perspective.
However, certain risk factors warrant attention. The company has recently increased its long-term debt by USD 2.4 billion over the past three years, although this remains at acceptable levels. The 23 insider selling transactions, totaling 529,104 shares, without any insider purchases, may raise concerns about confidence among insiders. Moreover, the stock’s high valuation metrics, including a price-to-book ratio of 8.29 and a price-to-sales ratio of 5.12, both near decade highs, suggest the stock may be overvalued. Additionally, the dividend yield is near a 10-year low, which could indicate limited income potential for yield-focused investors.
In summary, while PG’s financial health appears robust, the high valuation and insider selling activity could pose risks. This suggests investors should carefully weigh these factors against the company’s strong operational performance.
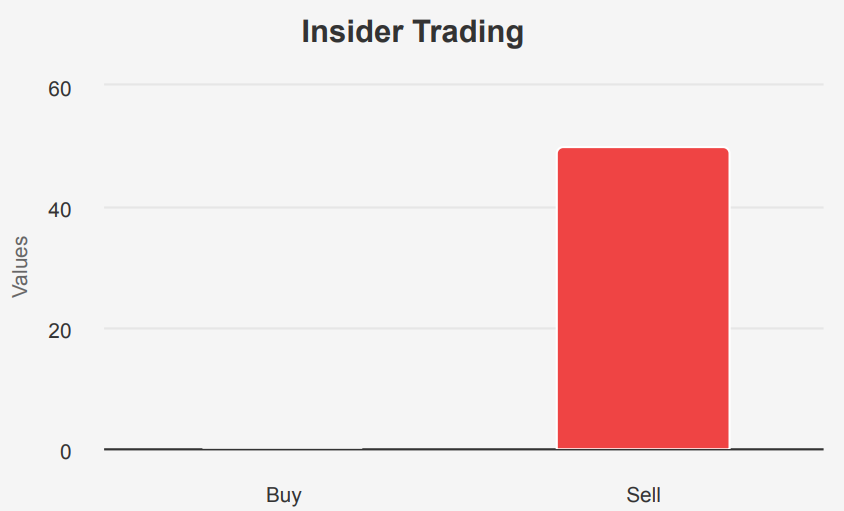
Procter & Gamble Stock: Insiders Sell Amid Institutional Confidence
Over the past year, insider trading activity at Procter & Gamble stock has shown a consistent trend towards selling, with no recorded insider purchases. In the last three months alone, there have been 23 insider sales, increasing to 30 over six months and totaling 50 for the year. This indicates a steady disposition among insiders to divest their holdings.
Despite this selling trend, insider ownership remains relatively low at 0.29%, suggesting that company insiders hold a minimal stake in the company. Furthermore, institutional ownership stands significantly higher at 67.71%, highlighting strong interest and investment from institutional investors. This often signals confidence in the company’s long-term prospects.
While frequent insider selling might raise questions regarding the insiders’ outlook on the company, the substantial institutional ownership could counterbalance these concerns, implying that professional investors remain optimistic about PG’s performance. Nonetheless, investors should consider these insider trends in conjunction with broader market conditions and company fundamentals before making investment decisions.
Procter & Gamble: Liquidity, Dark Pools, and Trading Strength
Procter & Gamble stock exhibits a strong liquidity position with a daily trading volume of 6,891,609 shares, surpassing its two-month average daily trading volume of 6,736,261 shares. This indicates active trading interest and sufficient liquidity to accommodate large trades without significantly impacting the stock price.
The Dark Pool Index (DPI) stands at 52.05%, suggesting that over half of the trades are executed in off-exchange venues. A DPI above 50% can imply significant institutional participation, as large investors often prefer dark pools to minimize market impact and maintain trading secrecy.
Overall, PG’s liquidity profile, supported by high trading volumes and a substantial DPI, indicates a healthy trading environment. When making trading decisions, investors should consider these liquidity metrics alongside other factors, such as market conditions and individual investment strategies.
Procter & Gamble’s Strategic Growth in Government Contracts
Procter & Gamble’s government contract earnings reveal fluctuations over the years, with noticeable surges in 2015 and a significant leap in 2020. The 2015 increase to $305,974 suggests a strong contract acquisition or expansion, while 2020’s staggering $7,446,322 indicates substantial government reliance, possibly due to increased demand for essential goods. The pattern reflects strategic positioning and adaptability to government needs, highlighting P&G’s capability to secure lucrative contracts in critical times.
Procter & Gamble’s Patent Trends: Strategic Shifts in Innovation
Procter & Gamble’s patent filings in the U.S. have experienced fluctuations over the past years. After peaking in 2020 with 570 patents, there was a noticeable decline, reaching 444 in 2022. This downward trend continued into 2023, with 477 patents recorded, and is projected to drop further to 393 in 2024. These changes could reflect strategic shifts in R&D focus or market conditions affecting innovation priorities within the company.
Congressional Trades Reveal Divergent Views on PG Stock
In early September 2024, there were notable transactions involving Procter & Gamble by U.S. House of Representatives members. On September 4, Representative John James, a Republican, sold PG shares valued between $1,001 and $15,000. This transaction was reported on September 6, indicating a timely disclosure within two days of the sale. Meanwhile, Representative Lloyd Doggett, a Democrat, made a purchase of PG shares in a similar value range between $1,001 and $15,000 on August 15, reported nearly a month later on September 9.
The contrasting actions of members from different parties could reflect differing outlooks or strategies regarding PG’s market performance. While James opted to reduce his holdings in PG, Doggett saw potential in acquiring more shares. These trades underscore the diversity in investment strategies among legislators, influenced by their individual assessments of market conditions and company prospects.
Disclosures:
On the date of publication, Yiannis Zourmpanos did not hold (either directly or indirectly) any positions in the securities mentioned in this article. This report has been generated by our stock research platform, Yiazou IQ, and is for educational purposes only. It does not constitute financial advice or recommendations.